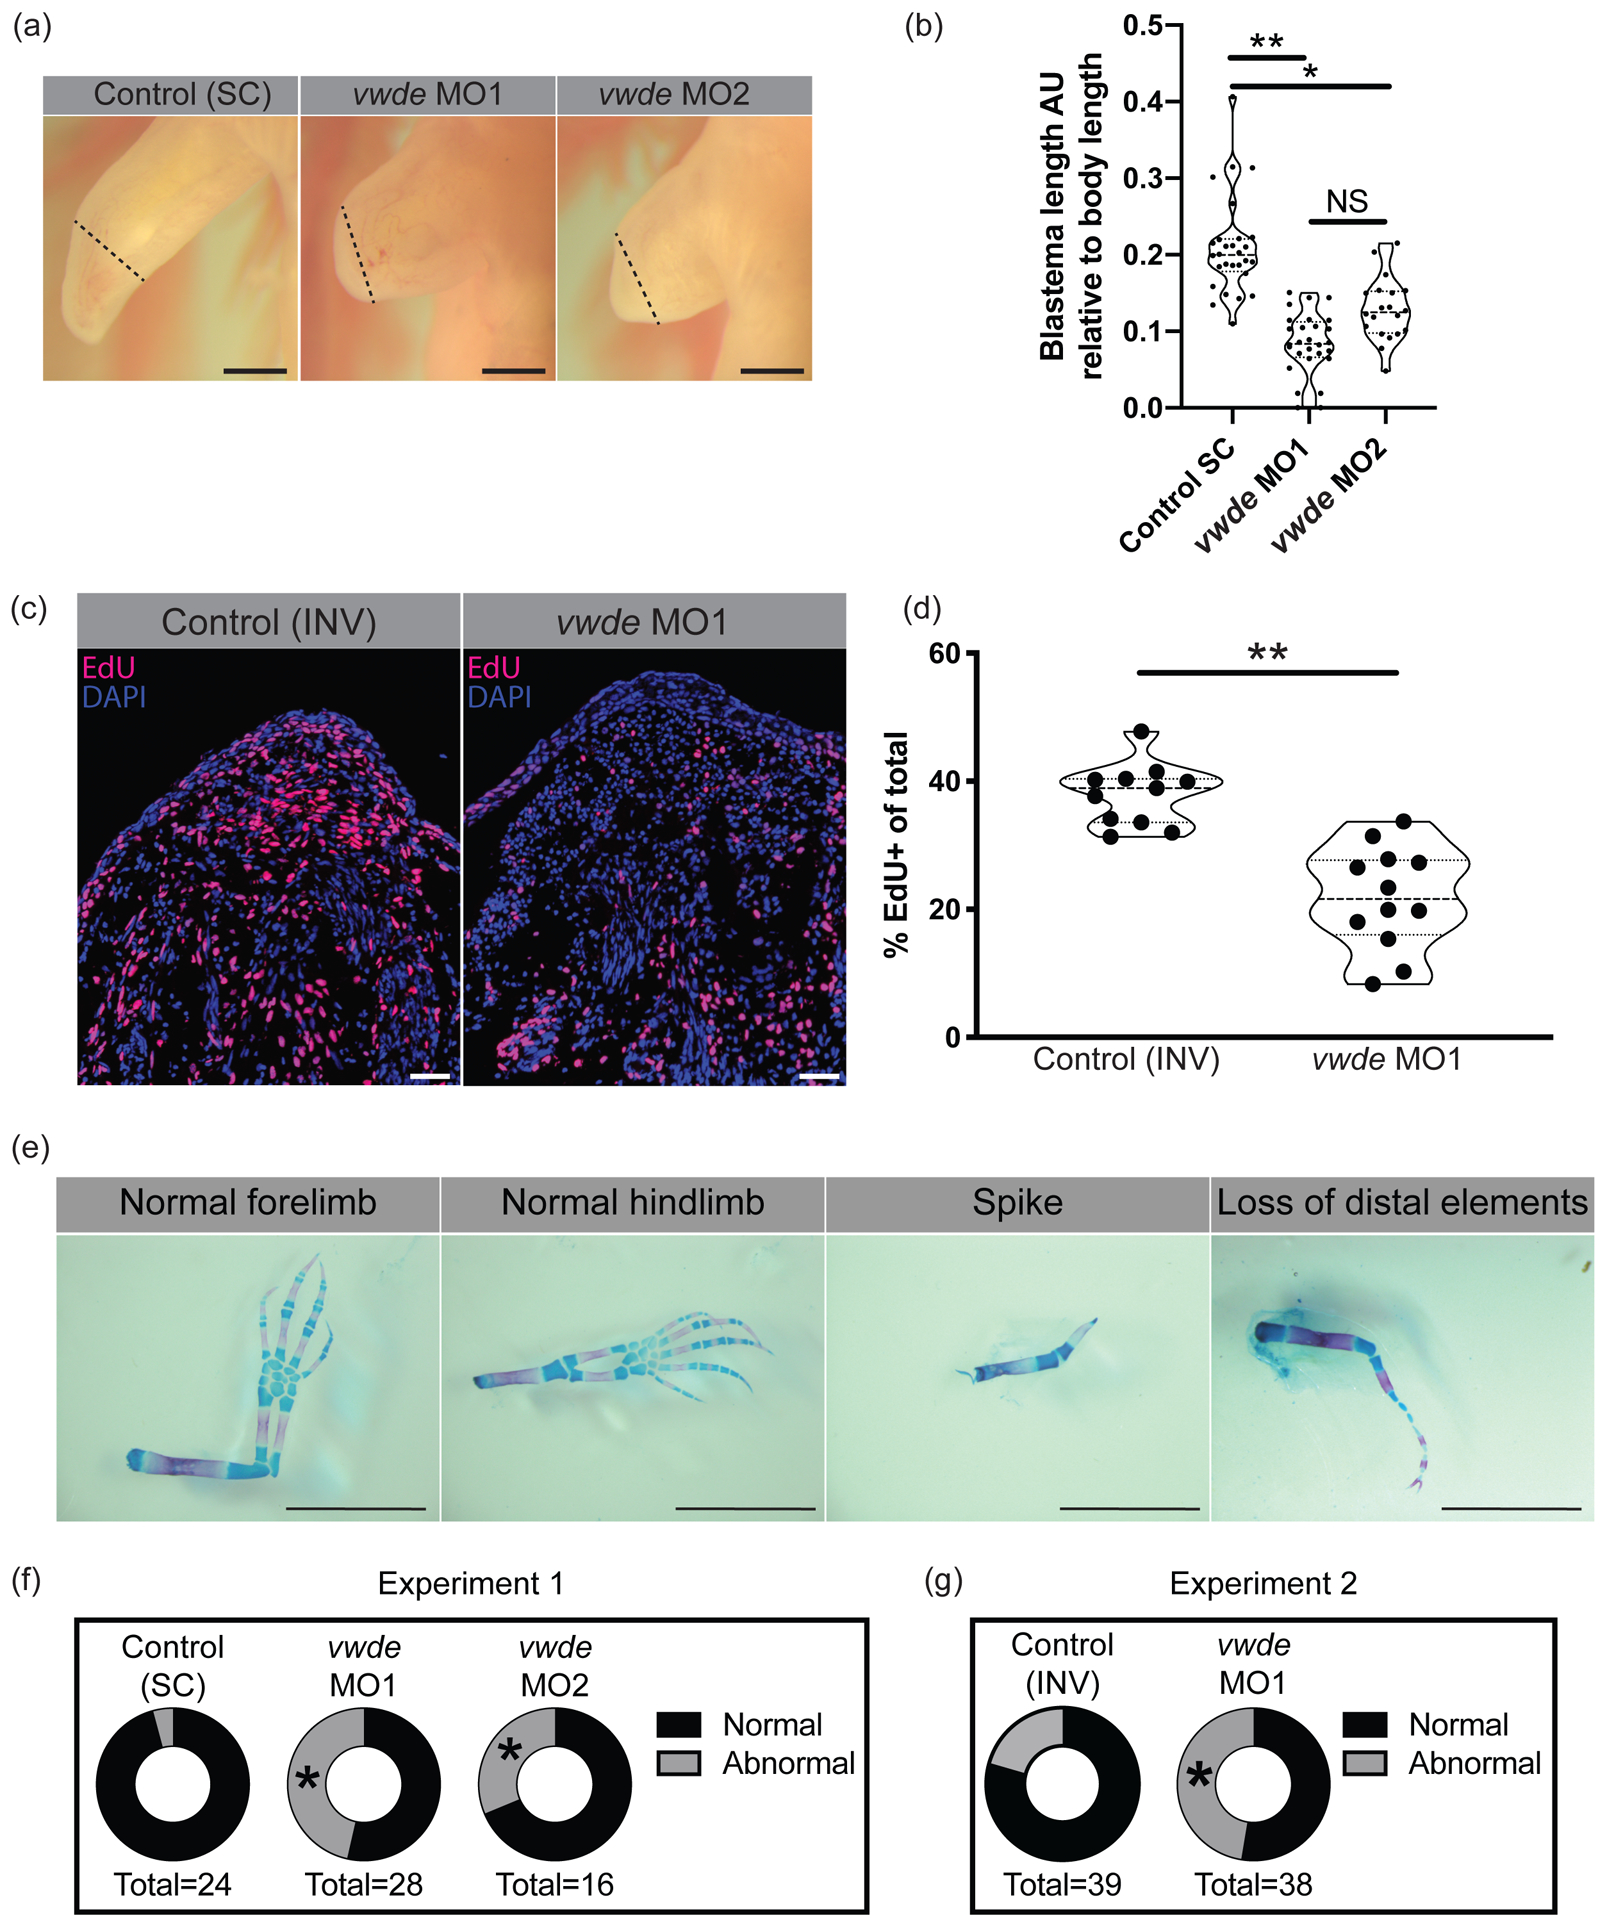
Figure 4: Vwde is essential for limb regeneration.

(A) Representative images of blastemas 16 days post-amputation (9 days post-morpholino administration) from standard control morpholino (“Control (SC)”), vwde-targeting morpholino 1 (vwde MO1), and vwde-targeting morpholino 2 (vwde MO2). Dotted line indicates amputation plane, blastemas are all tissue distal to amputation plane. Scale bars at 1mm. (B) Quantification of blastema length 16 days-post amputation. Median and quartiles noted with dotted lines, ** indicates P< 0.01, * is P< 0.05 by nested T test. (C) Representative EdU stained sections of blastemas 10 dpa (3 days post-electroporation) of vwde morpholino 1 inverted (“Control (INV)”) and vwde-targeting morpholino 1. Scale bars are 100μm (D) Quantification of percent of blastema cells positive for EdU in control (INV) and knockdown (vwde MO1). Each dot represents a limb, 4–5 animals per group. Median and quartiles noted with dotted lines, ** indicates P< 0.01 by nested T test. (E) Representative skeletal preparations of limbs after full regeneration after knockdown of Vwde at 7 dpa. From left to right, normal forelimb, normal hindlimb, spike, and loss of distal elements. Scale bars are 5 mm. (F) Donut plots of regenerative outcomes, pooled as abnormal versus normal from experiment with Control (SC), vwde MO1 and vwde MO2. Asterisk (*) indicates P< 0.05 by Fisher’s exact test comparing Control (SC) versus vwde MO1 and Control (SC) versus vwde MO2. (G) Donut plots of regenerative outcomes, pooled as abnormal versus normal from experiment with Control (INV) and vwde MO1. Asterisk (*) indicates P< 0.05 by Fisher’s exact test comparing outcomes from Control (INV) compared to vwde MO1.
