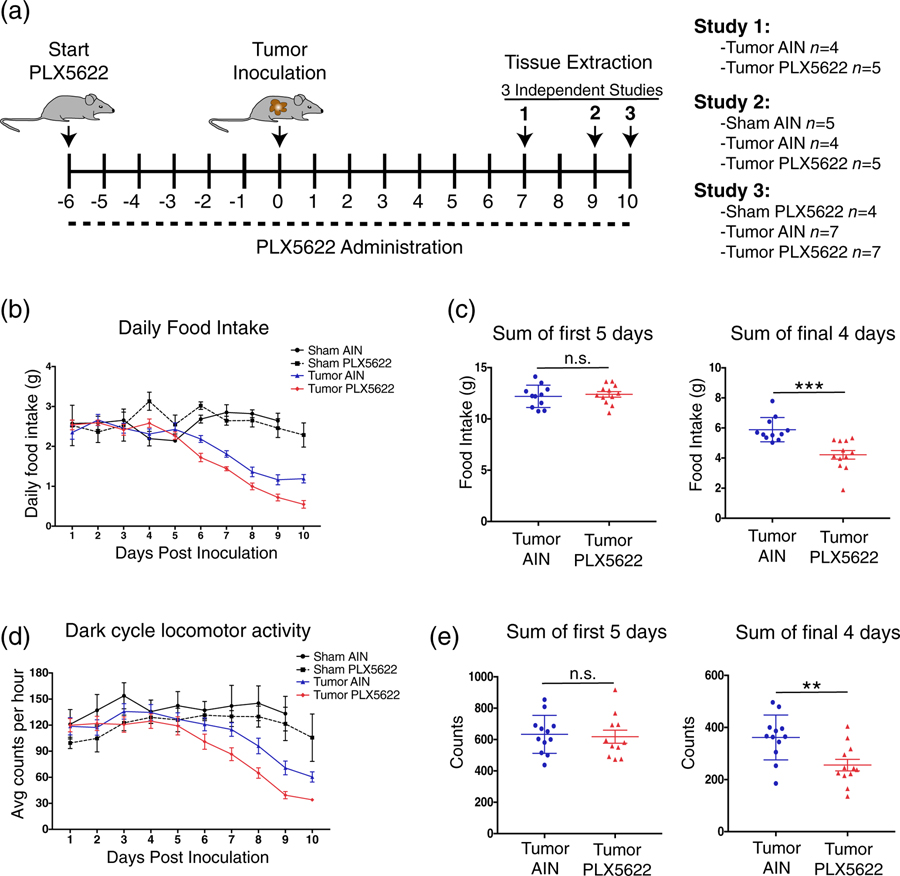
FIGURE 4.
Microglia depletion worsens anorexia and decreases locomotor activity during PDAC. (a) Schematic of PLX5622 treatment protocol and tumor inoculation. Diagram depicts three independent studies investigating various stages of cachexia. Numbers listed on number line are in relation to tumor inoculation. Day 0 = tumor inoculation day. (b) Daily food intake after tumor inoculation, with two sham groups shown for reference. AIN = control chow. For food intake analysis, study 2 and 3 were combined. (c) Total food intake during the first 5 days of the study (pre-cachexia stage) and final 4 days of the study (cachexia stage). n.s. = not significant, ***p < .001 for Student’s t-test. (d) Dark cycle home cage locomotor activity after tumor inoculation, with two sham groups shown for reference. Data shown are study 2 and 3 pooled. (e) Sum of average hourly counts for the first 5 days of the study (pre-cachexia stage) and final 4 days of the study (cachexia stage). n.s. = not significant, **p < .01 in Student’s t-test

