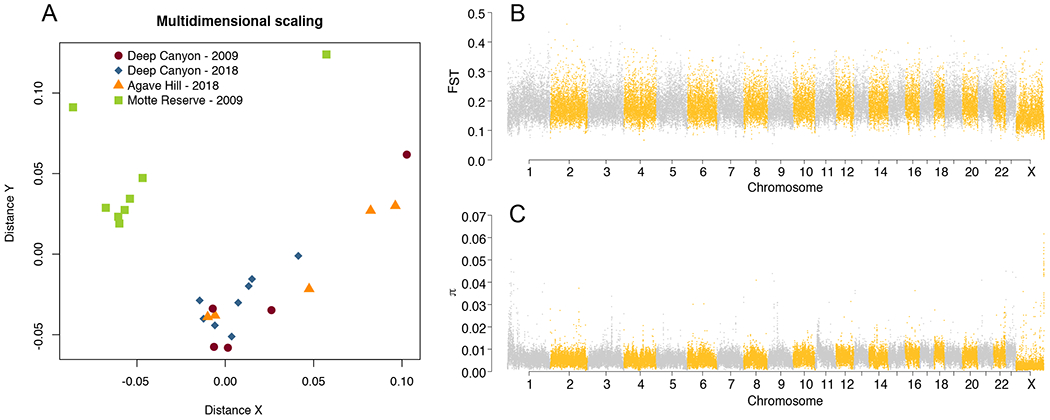
Figure 1.

Diversity and differentiation in the cactus mouse. a) MDS plot showing relative distance among individuals based on downsampling to a single base at 43.7 million variable sites. Note outlier from Motte on the far left side of the plot. b) Manhattan plot showing patterns of differentiation based on FST between Motte and Deep Canyon Reserves (after outlier removal). c) Manhattan plot showing patterns of nucleotide diversity π from all samples combined (after outlier removal).
