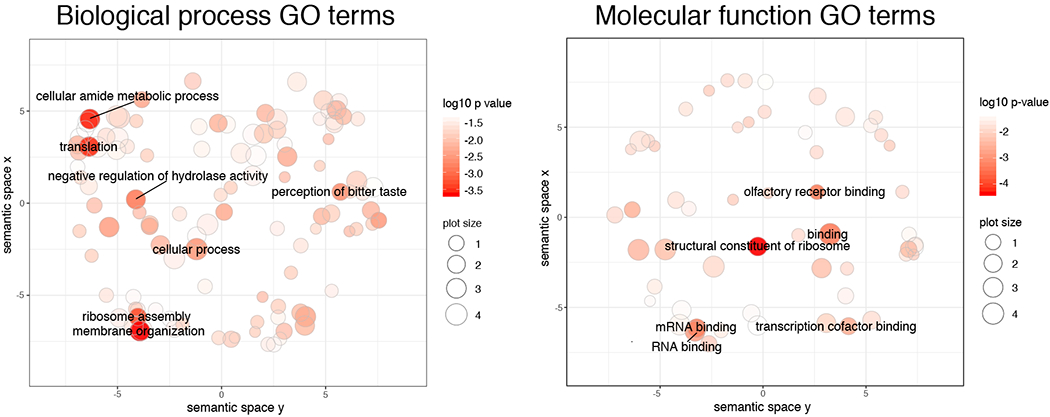
Figure 4.

Scatterplot showing clusters representative of enriched GO terms after semantic reduction in REVIGO for biological process GO terms (left) and molecular function GO terms (right). Only the names of GO clusters with a p-value < 10−2.5 are shown for visual clarity. The full list of genes and reduced GO terms in REVIGO can be found in Supplementary Tables 3, 4 and 5.
