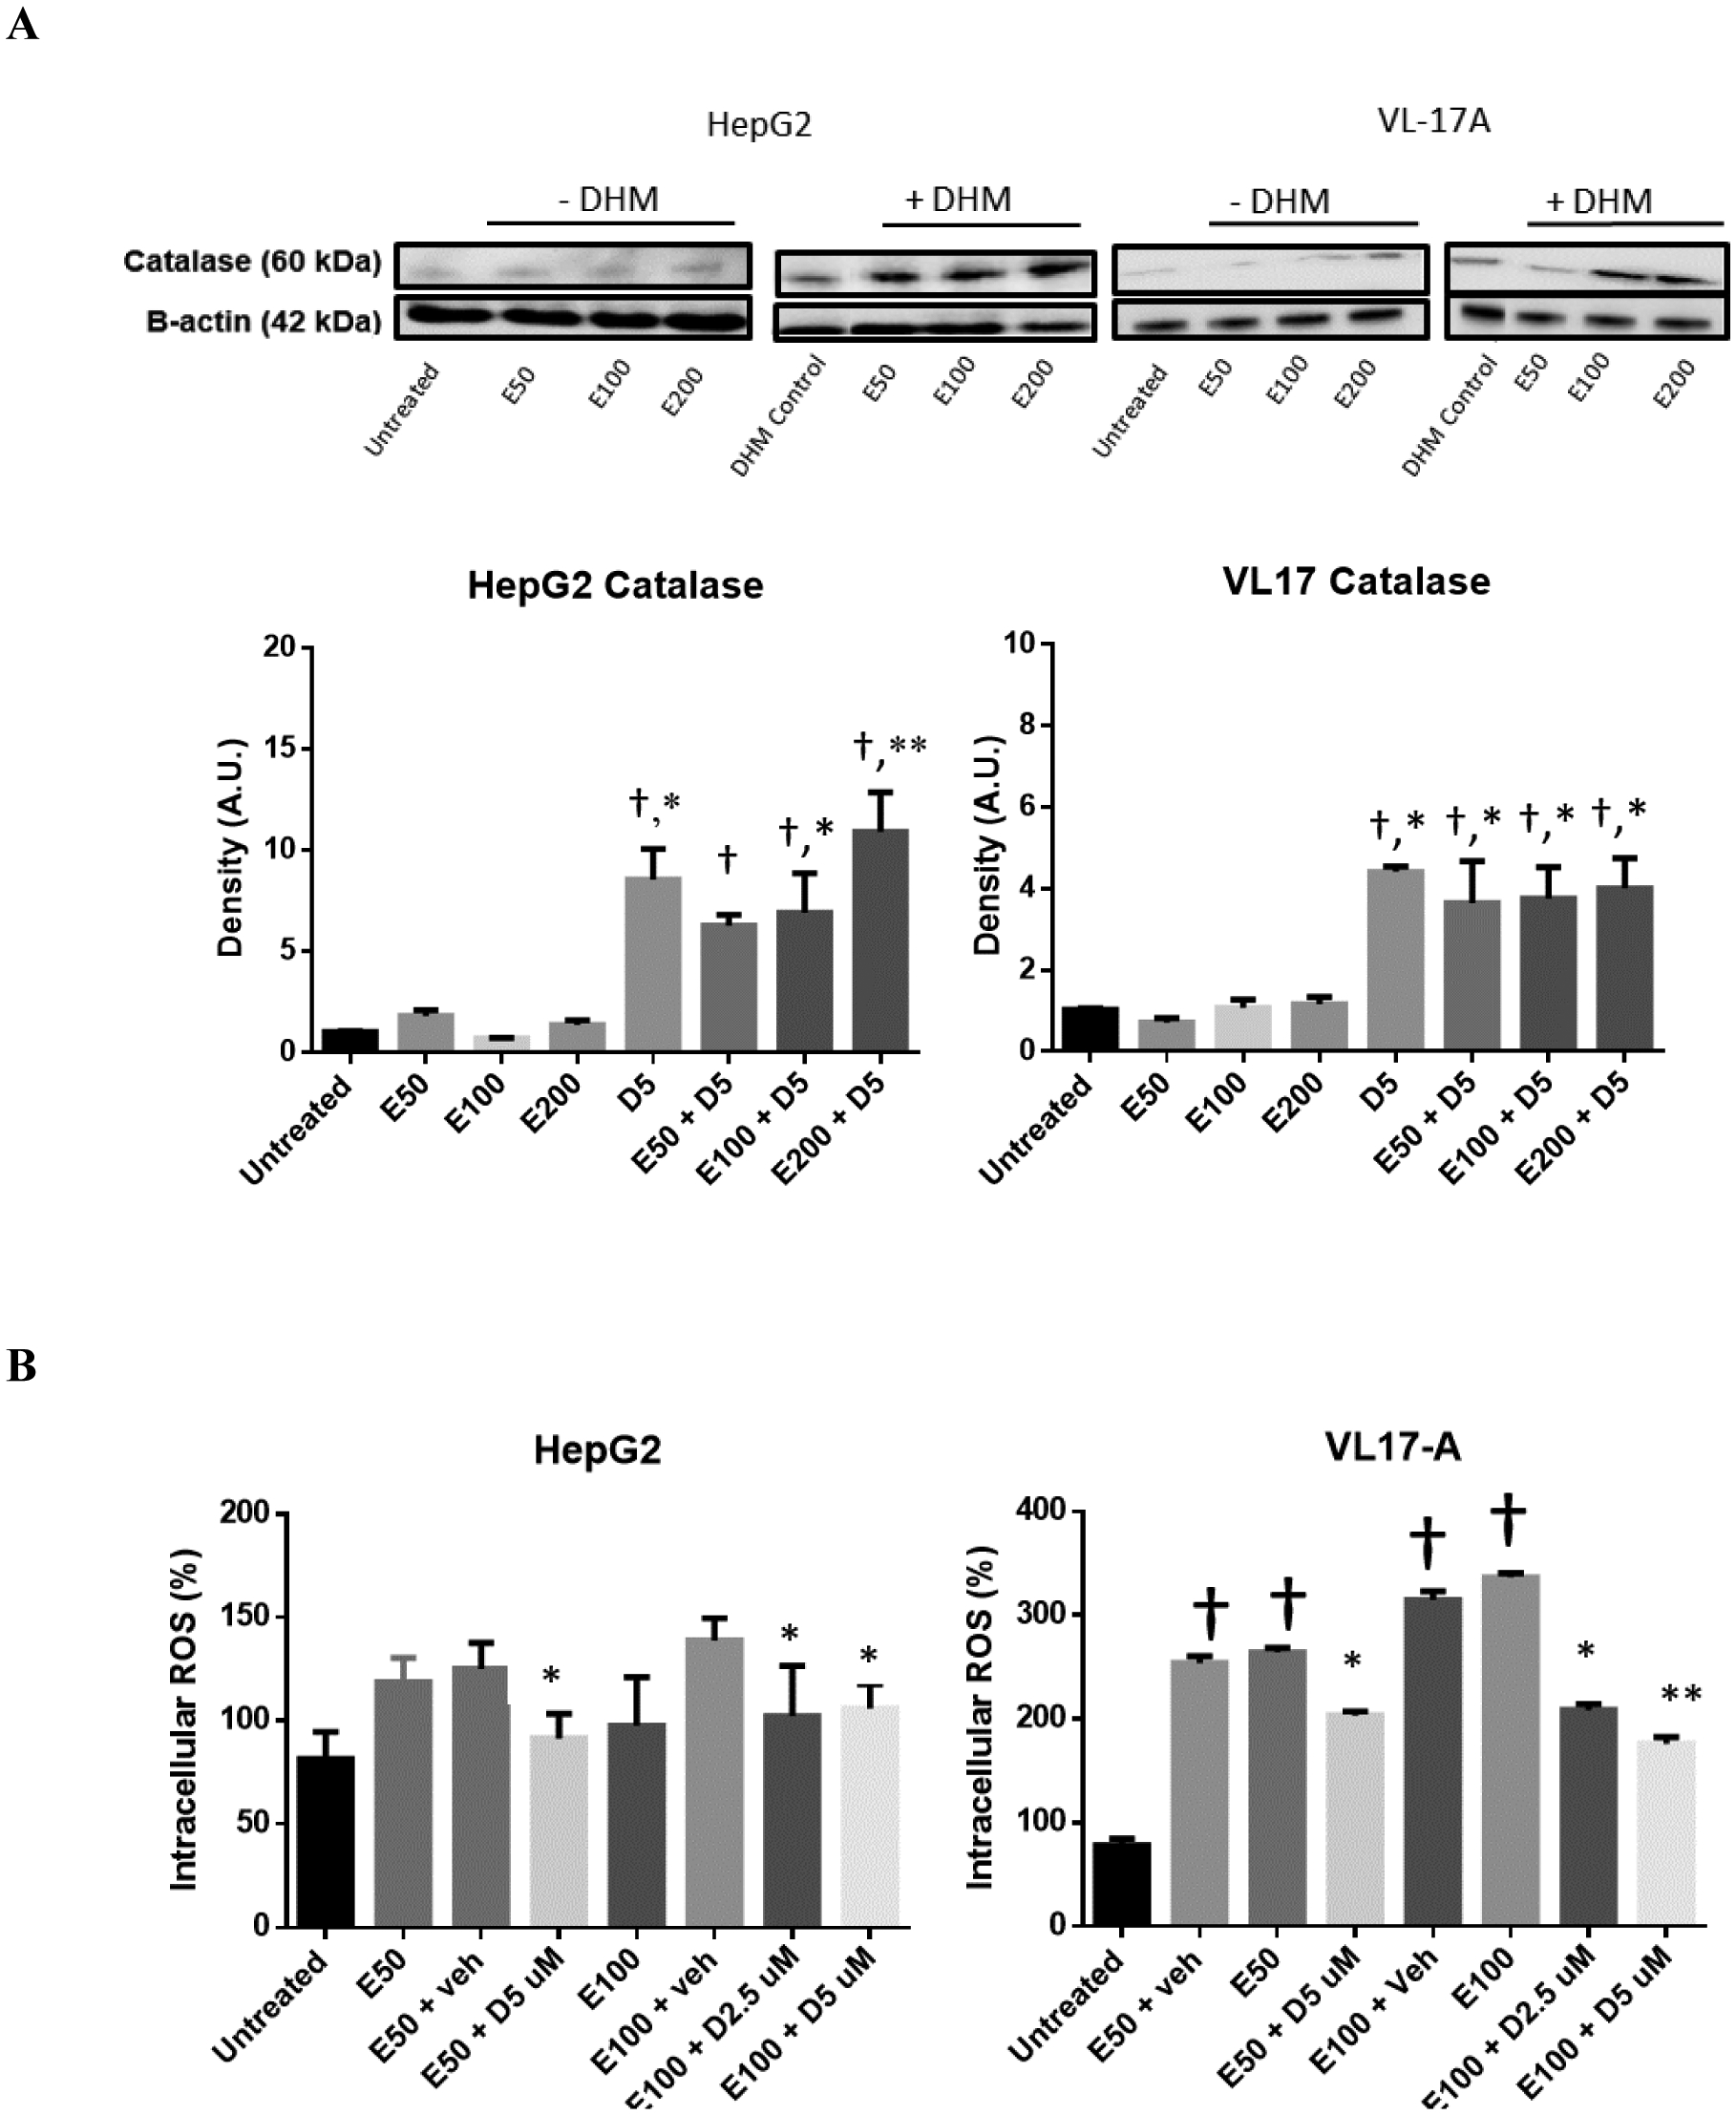
Fig 7.

DHM increases the expression of catalase and suppresses ethanol-mediated ROS generation in vitro. A) Representative Western blot image of HepG2 and VL-17A cells cultured in ethanol and either 5 μM DHM or untreated for 24 hours and immunoblotted with anti-Catalase mAb. B) HepG2 and VL-17A cells were cultured in 50– 100 mM ethanol and treated with 2.5 – 5 μM DHM or untreated for 24 hours before fluorometric analysis of intracellular ROS levels. Bar graphs were generated by quantifying blots from three independent experiments using ImageJ and normalized against intensity of the untreated lane. Data represented as mean ± SEM. *p < 0.05 and p** < 0.01 compared with corresponding ethanol controls and normalized with untreated controls; †, p<0.05 vs. untreated control. n=3/group. ROS = reactive oxygen species. A.U. = arbitrary units.
