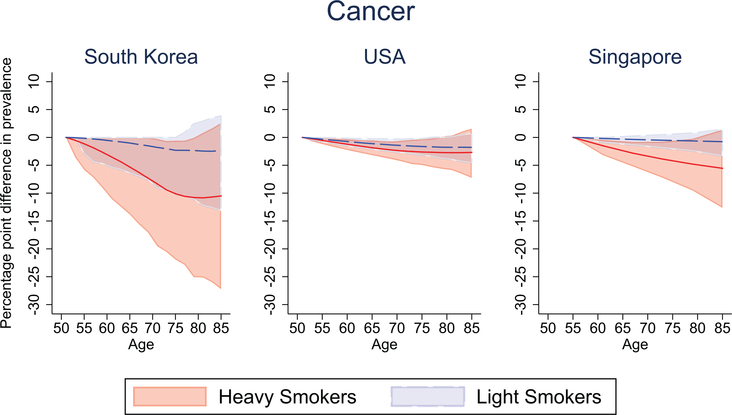
FIGURE 2.
Percentage point difference in cancer prevalence between the pre-treated and post-treated group, among light and heavy male smokers. Solid lines (red = “heavy smokers,” blue = “light smokers”) represent the mean difference in cancer prevalence between pre- and post-intervention. Confidence bounds represent the 95% credible interval from Monte Carlo uncertainty of 1,000 bootstrap samples

