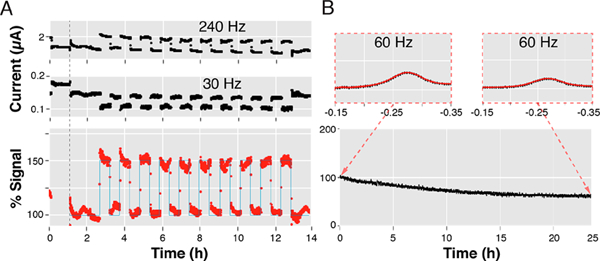
Figure 5.

Continuous analysis and visualization of long-duration electrochemical data without building temporary memory. By incorporating into our code high-efficiency visualization techniques such as “blitting” we have created a program that performs data analysis at a constant-speed. (A) To illustrate this, we have followed, in real time, the signaling of a tobramycin-detecting E-AB sensor interrogated every 20 s over 14 h as it was alternatively challenged every 30 min with either tobramycin-containing serum or drug-free serum. The % Signal was calculated via the equation shown in Figure 3B, except using square-wave frequencies 240 and 30 Hz. (B) This ability is ideally suited to evaluate sensor stability, as shown for an electrode functionalized with redox-reporter-modified protein and immersed in a solution containing 10 M denaturant (urea) that we interrogated every 2 min over the course of 25 h.
