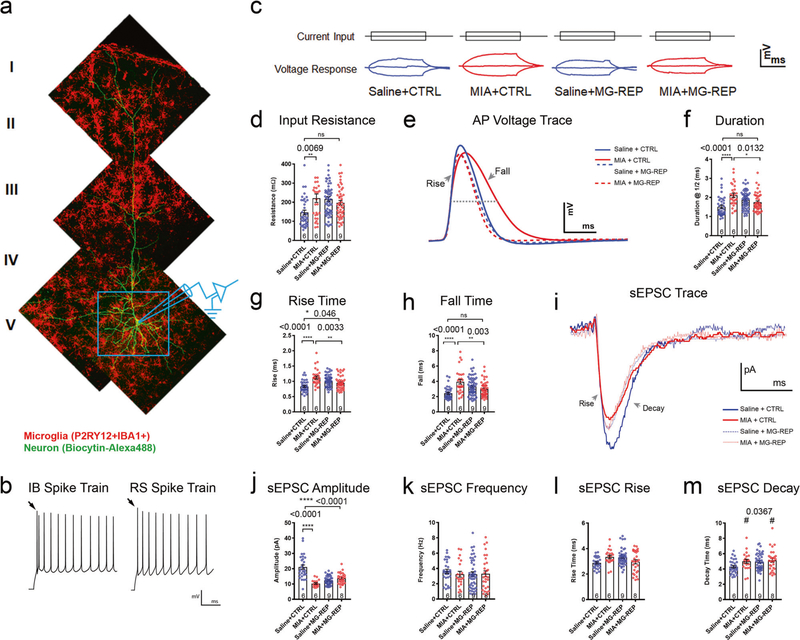
Fig. 4. MIA-induced alterations to intrinsic membrane and excitatory synaptic current properties are ameliorated by microglial repopulation.
a Experimental design: Whole-cell patch-clamp recordings were performed on layer V pyramidal neurons. Merged confocal z-stacks showing biocytin-filled neuron (green) and P2RY12+IBA1+ microglia (red) from layer V to layer I of the medial prefrontal cortex (mPFC) of male mouse. b Representative repetitive action potential firing responses to a +120 pA current step of an intrinsically bursting (IB) and a regular spiking (RS) layer V pyramidal neuron. Note the initial action potential doublet in the IB cell (arrow, left), compared with the initial single action potential in the RS cell (arrow, right). Scale bar: y-axis = 20 mV, x-axis = 250ms. c Voltage responses (bottom traces) to 200ms depolarizing (+20 pA) and hyperpolarizing (−20 pA) current steps (top traces) in representative neurons from each of the four groups. Scale bar: y-axis = 4 mV, x-axis = 100 ms. d–h: Intrinsic properties of layer V IB cells: d Mean input resistance (Rn) Prenatal treatment effect, F(1,164)= 3.4573, p = 0.0648, Drug effect, F(1,164) = 2.6039, p = 0.1085, Interaction effect, F(1,164)= 10.40917, p = 0.0015. e Representative traces of action potentials from layer V pyramidal neurons in slices prepared from Saline + CTRL (blue), MIA + CTRL (red), Saline+ MG-REP (blue dotted) and MIA + MG-REP (red dotted) mice, which revealed MIA offspring displaying significantly slower AP kinetics (f–h) that were recovered via repopulation. Scale bar: y-axis = 20 mV, x-axis = 1 ms. f Mean duration at half maximal amplitude of the action potential (denoted by horizontal dotted line in e). Prenatal treatment effect, F(1,168) = 9.570, p = 0.0023 Drug effect, F(1,168) = 0.001748, p = 0.9667, Interaction effect, F(1,168) = 21.06908, p < 0.0001. g Mean rise, Prenatal treatment effect, F(1,166) = 12.44126, p = 0.0005, Drug effect, F(1,166) = 0.02641, p = 0.8711, Interaction effect, F(1,166)= 29.5484 p < 0.0001. h Fall time of the action potential. Prenatal treatment effect, F(1,166) = 10.2777, p = 0.0016 Drug effect, F(1,166)= 0.076, p = 0.7831, Interaction effect, F(1,166)= 25.099, p < 0.0001. Neurons in each group: n = (38/6/4, 30/6/4, 60/9/6, 45/9/7) cells/male mice/litters for (Saline + CTRL, MIA + CTRL, Saline + MG-REP, MIA + MG-REP). i Representative waveforms of averaged spontaneous excitatory postsynaptic current (sEPSC) in Saline+ CTRL (blue), MIA + CTRL (red), Saline + MG-REP (blue dotted), and MIA + MG-REP (red dotted) layer V neurons indicating significant MIA effect in certain sEPSC properties. Scale bar: y-axis= 4pA, x-axis = 10ms. sEPSC of layer V IB cells: j Mean sEPSC amplitude, Prenatal treatment effect, F(1,114)= 27.6523, p < 0.0001, Drug effect, F(1,114) = 9.811, p = 0.0022, Interaction effect, F(1,114) = 47.32085, p < 0.0001. k Mean sEPSC frequency, Prenatal treatment effect, F(1,121)= 0.20, p = 0.6555 Drug effect, F(1,121)= 0.216094, p = 0.6463, Interaction effect, F(1,121) = 0.4017, p = 0.5274. l Mean sEPSC rise time, Prenatal treatment effect, F(1,121) = 0.2817, p = 0.5966 Drug effect, F(1,121)= 0.3228, p = 0.8577, Interaction effect, F(1,121)= 11.2053, p = 0.0011. m Mean sEPSC decay time, Prenatal treatment effect#, F(1,119) = 4.4625, p = 0.0367 Drug effect, F(1,119) = 2.9849, p = 0.0866, Interaction effect, F(1,119) = 1.4879, p = 0.2250. Neurons in each group: n = (29/6/4, 20/6/4, 46/9/6, 30/8/6) cells/male mice/litters in the same order as d–h. *p < 0.05, **p < 0.01, ***p < 0.001 and ****p < 0.0001, ns denotes no significance; determined by 2-way ANOVA (alpha= 0.05) and Tukey’s post-hoc. Graphs indicate mean ± s.e.m.

