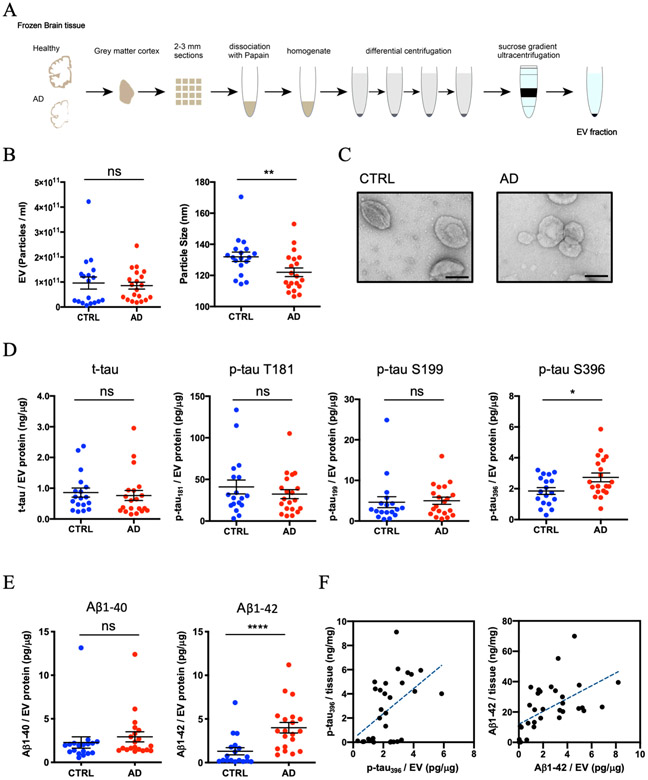
Figure 1. Biophysical and biochemical characterization of EVs isolated from AD and Control brain tissues:
A) Schematic of extracellular vesicle isolation protocol from human frozen brain tissue (see supplementary file for detailed methods). B) Left: Particle numbers of brain-derived EV fraction from control (CTRL) or AD by Nanoparticle tracking analysis. p = 0.6075 by Mann-Whitney test. Right: Particle size of brain-derived EV fraction. p = 0.0095 by Mann-Whitney test. C) TEM image of frozen human brain-derived EVs. Scale bar = 100 nm. Left: CTRL, Right: AD. D) Comparison of total tau and tau phosphorylated at threonine 181, serine 199, and serine 396 in EVs. pSer 396 tau; p = 0.0375 by Mann-Whitney test. E) Comparison of Amyloid beta 1-40 or 1-42 in EVs. Aβ1-42; p < 0.0001 by Mann-Whitney test. F) Scattered plot of brain tissue homogenates and brain-derived EVs. Left: pS396 tau (r = 0.4897, p = 0.005 using two-tailed t-test), Right: Aβ1-42 (r = 0.5632, p = 0.0005 using two-tailed t-test).

