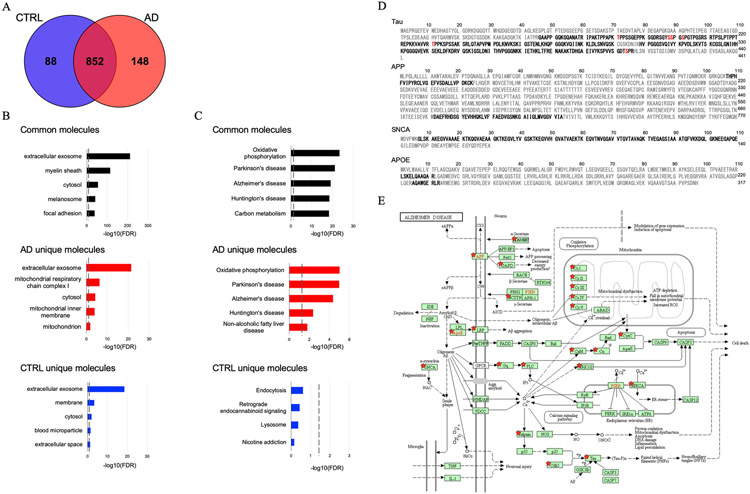
Figure 2. Proteomics profiling of EVs isolated from AD and CTRL brains:
A) Venn diagram representing the number of EV proteins differentially identified in CTRL and AD. B) Gene Ontology (GO) analysis using DAVID Bioinformatics Resources 6.8. The GO term of Top5 Cellular Component with −log10 (FDR p-value). (C) The GO term of Top5 Pathway Ontology with −log10 (FDR p-value). D) Sequence coverage of identified tryptic fragment peptide from Alzheimer’s disease-related protein (Tau, APP, SNCA, APOE) in AD group by LC-MS/MS analysis. Identified peptides and phosphorylation sites are shown in black and red bold, respectively. E) KEGG pathway of Alzheimer Disease. The 68 proteins identified in the AD group are highlighted by red stars.

