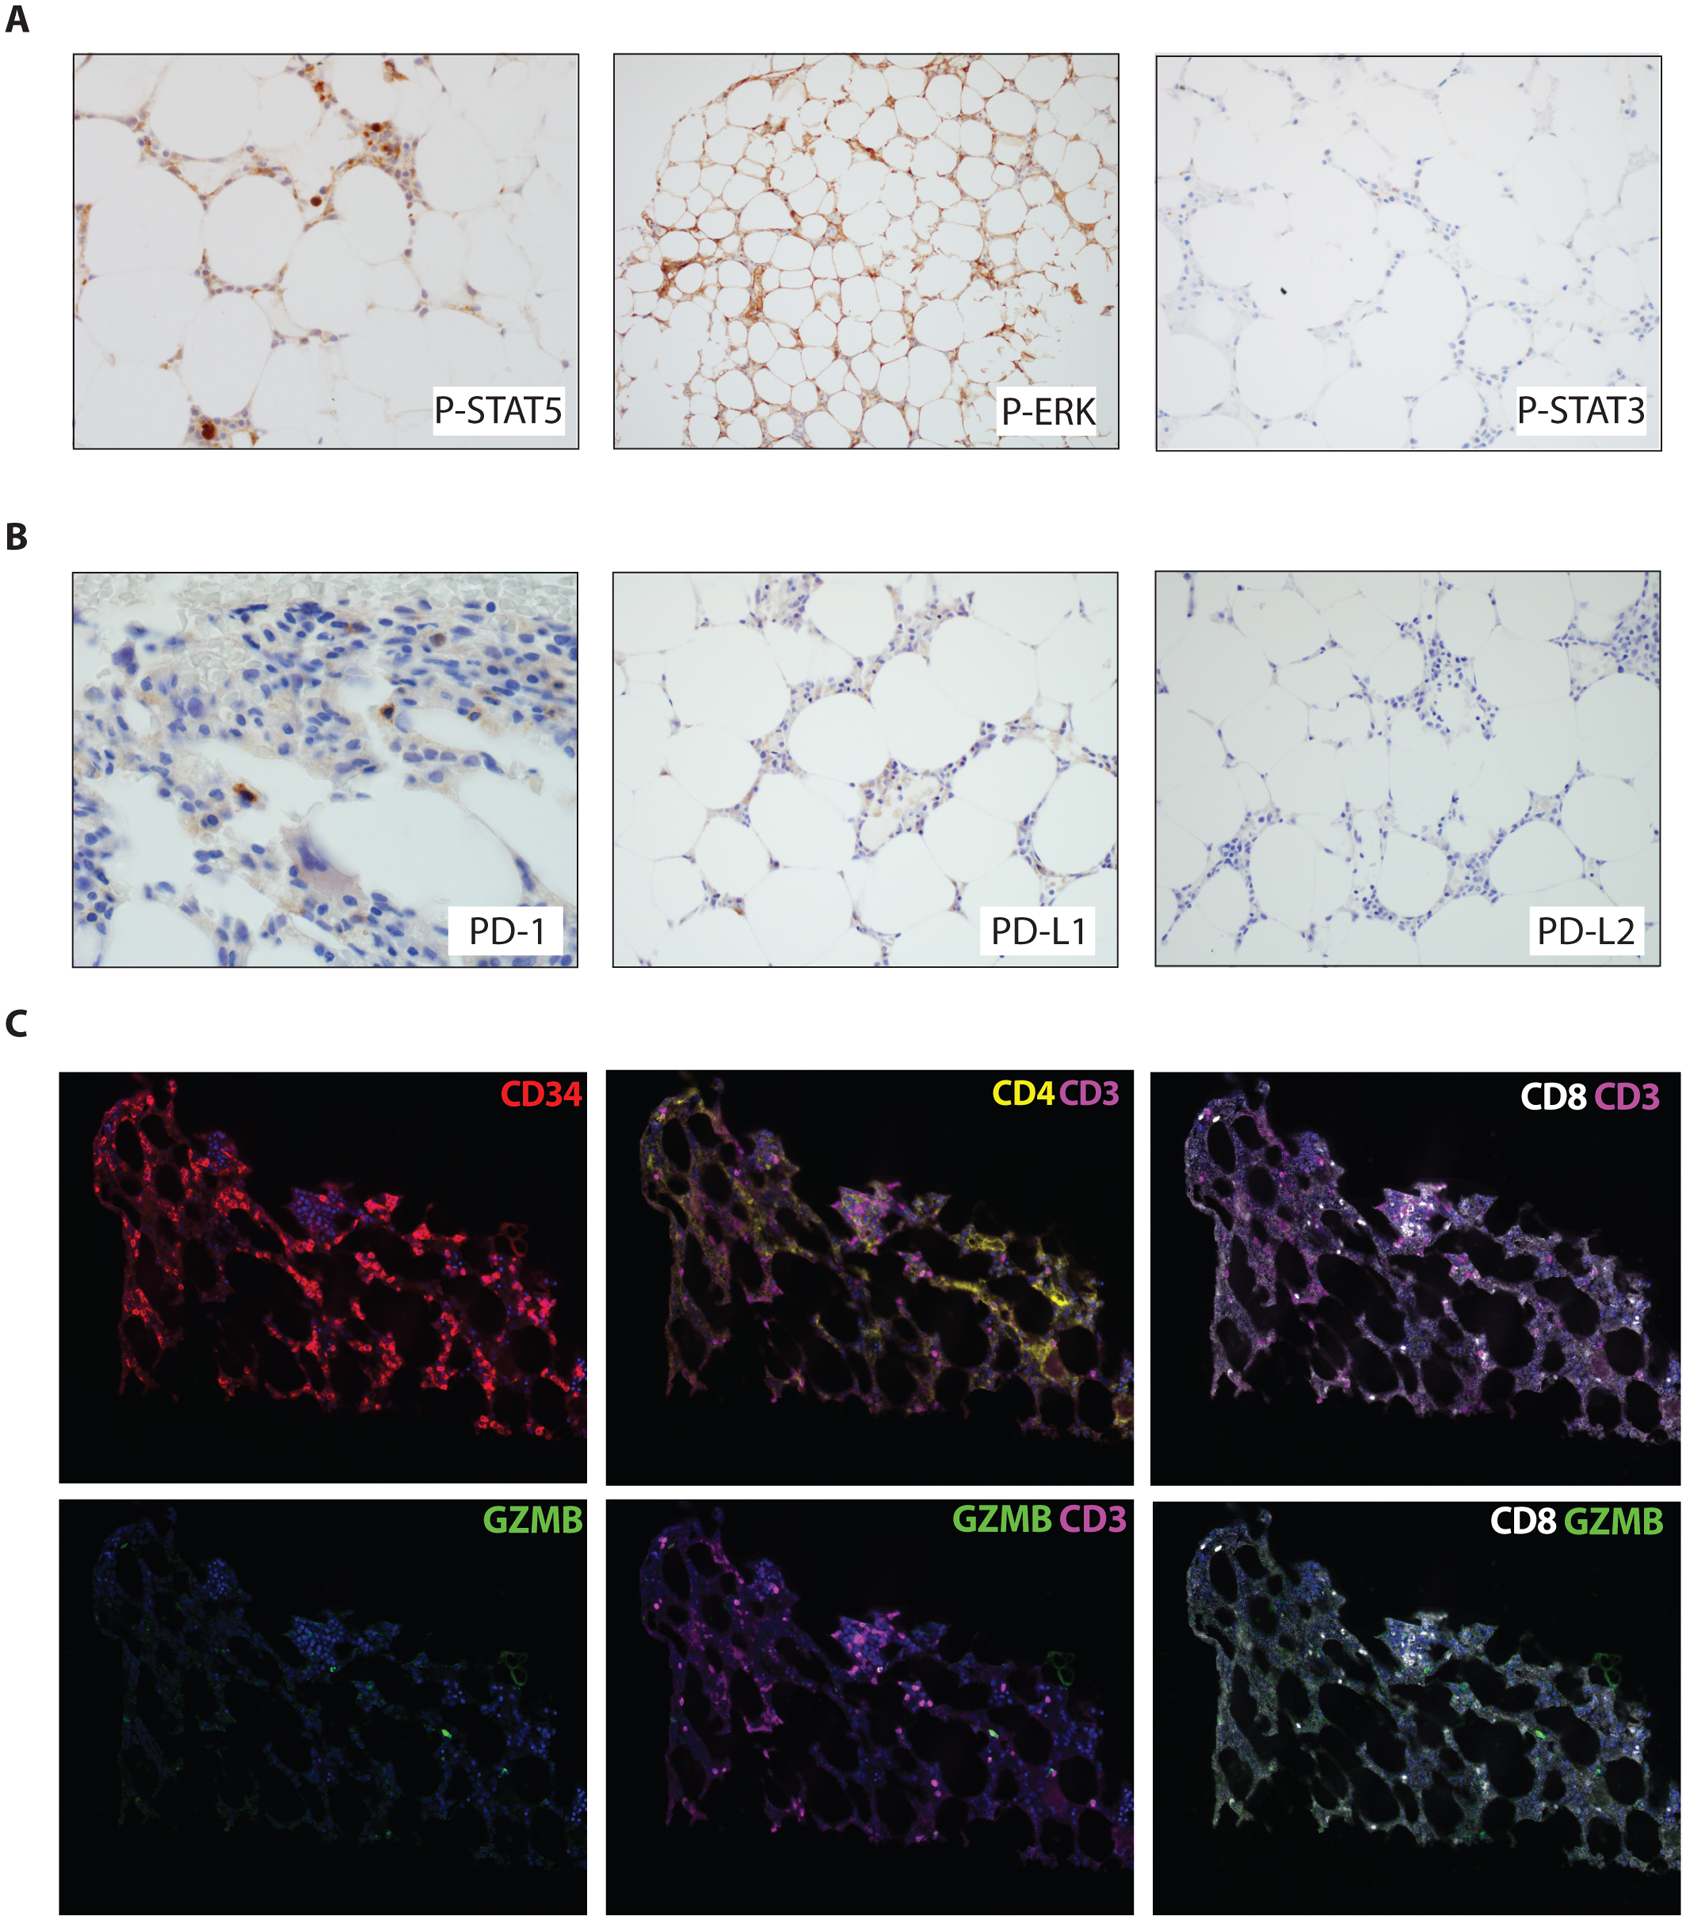
Figure 4. Immune signaling activation in P2RY8-CRLF2 fusion AML.

(A) Immunohistochemical photomicrographs of the bone marrow biopsy showing phospho-specific staining of STAT5 and ERK, but not STAT3. (B) Immunohistochemical photomicrographs of the bone marrow biopsy showing staining of PD-1 in scattered lymphoid cells. PD-L1 staining is equivocal, while PD-L2 is negative. (C) Using multiplex immunofluorescence microscopy, with digital image analysis, we find that the patient’s bone marrow is highly enriched with CD8+GZMB+ T-cells. CD34+ staining highlights the myeloblast population at the time of AML transformation. We further identify a population of CD3+CD4+ T-cells at baseline.
