Figure 2.
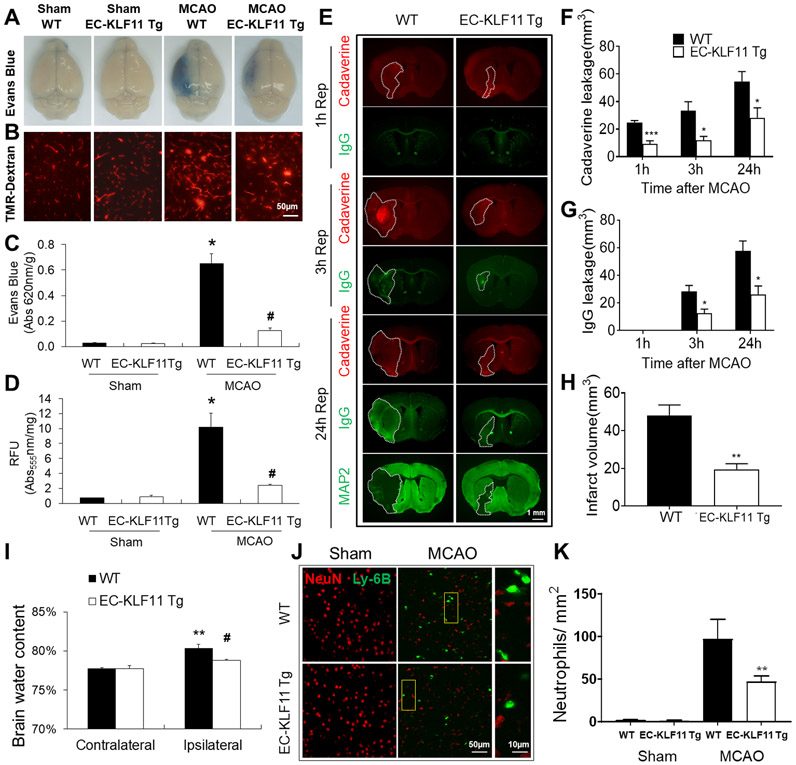
Targeted overexpression of KLF11 in endothelium ameliorates both early- and late-onset BBB impairments, edema, and neutrophil infiltration. EC-KLF11 Tg mice and WT controls were subjected to 1 h MCA occlusion followed by 1, 3, or 24 h reperfusion. (A) Extravasation of Evans blue dye and (B) 70 kDa TMR-Dextran 24 h after MCAO in whole brains or coronal sections was shown. Scale bar, 50 μm. (C-D) Quantification of Evans blue in panel A and TMR-Dextran in panel B. n=6 mice per group. (E) Representative images demonstrate the extravasation of Alexa Fluor 555 (0.95 kDa, red) or endogenous plasma IgG (~150 kDa, green) into brain parenchyma 1, 3, or 24 h after MCAO. At 24 h after MCAO, the area with loss of microtubule-associated protein 2 (MAP2) immunofluorescence illustrates the infarct zone on adjacent sections from the same brains. (Scale bar: 1 mm). (F-G) Quantitative analysis of the volume of the brain with leakage of cadaverine and IgG at indicated times of reperfusion after MCAO. n=5 mice per group. (H) Brain infarct volume at 24 h after MCAO was quantitatively measured on MAP2-stained coronal sections. n=5 mice per group. (I) Brain water content was measured by the wet/dry weight protocol as described in the “Material and Methods”. n=10 per group, ** p < 0.01 vs. WT contralateral hemisphere, # p < 0.05 vs. WT ipsilateral hemisphere. (J) Representative images taken from the ipsilateral periinfarct cortex after MCAO or the corresponding region after sham operation; markers used: Ly-6B (neutrophil), and NeuN (neuron) (Scale bar: 50 μm). Rectangle: the region enlarged in high-power images (third column). (Scale bar: 10 μm.) (K) Ly-6B+ cells were counted in the areas described in (J) and data are expressed as the number of cells per mm2. After MCAO, the number of infiltrated neutrophils is significantly less in EC-KLF11 Tg mouse brains compared with WT controls. n=5 mice per group. Data are expressed as mean ± SEM. * p < 0.05 vs. WT + sham group, # p < 0.05 vs. WT + MCAO group.

