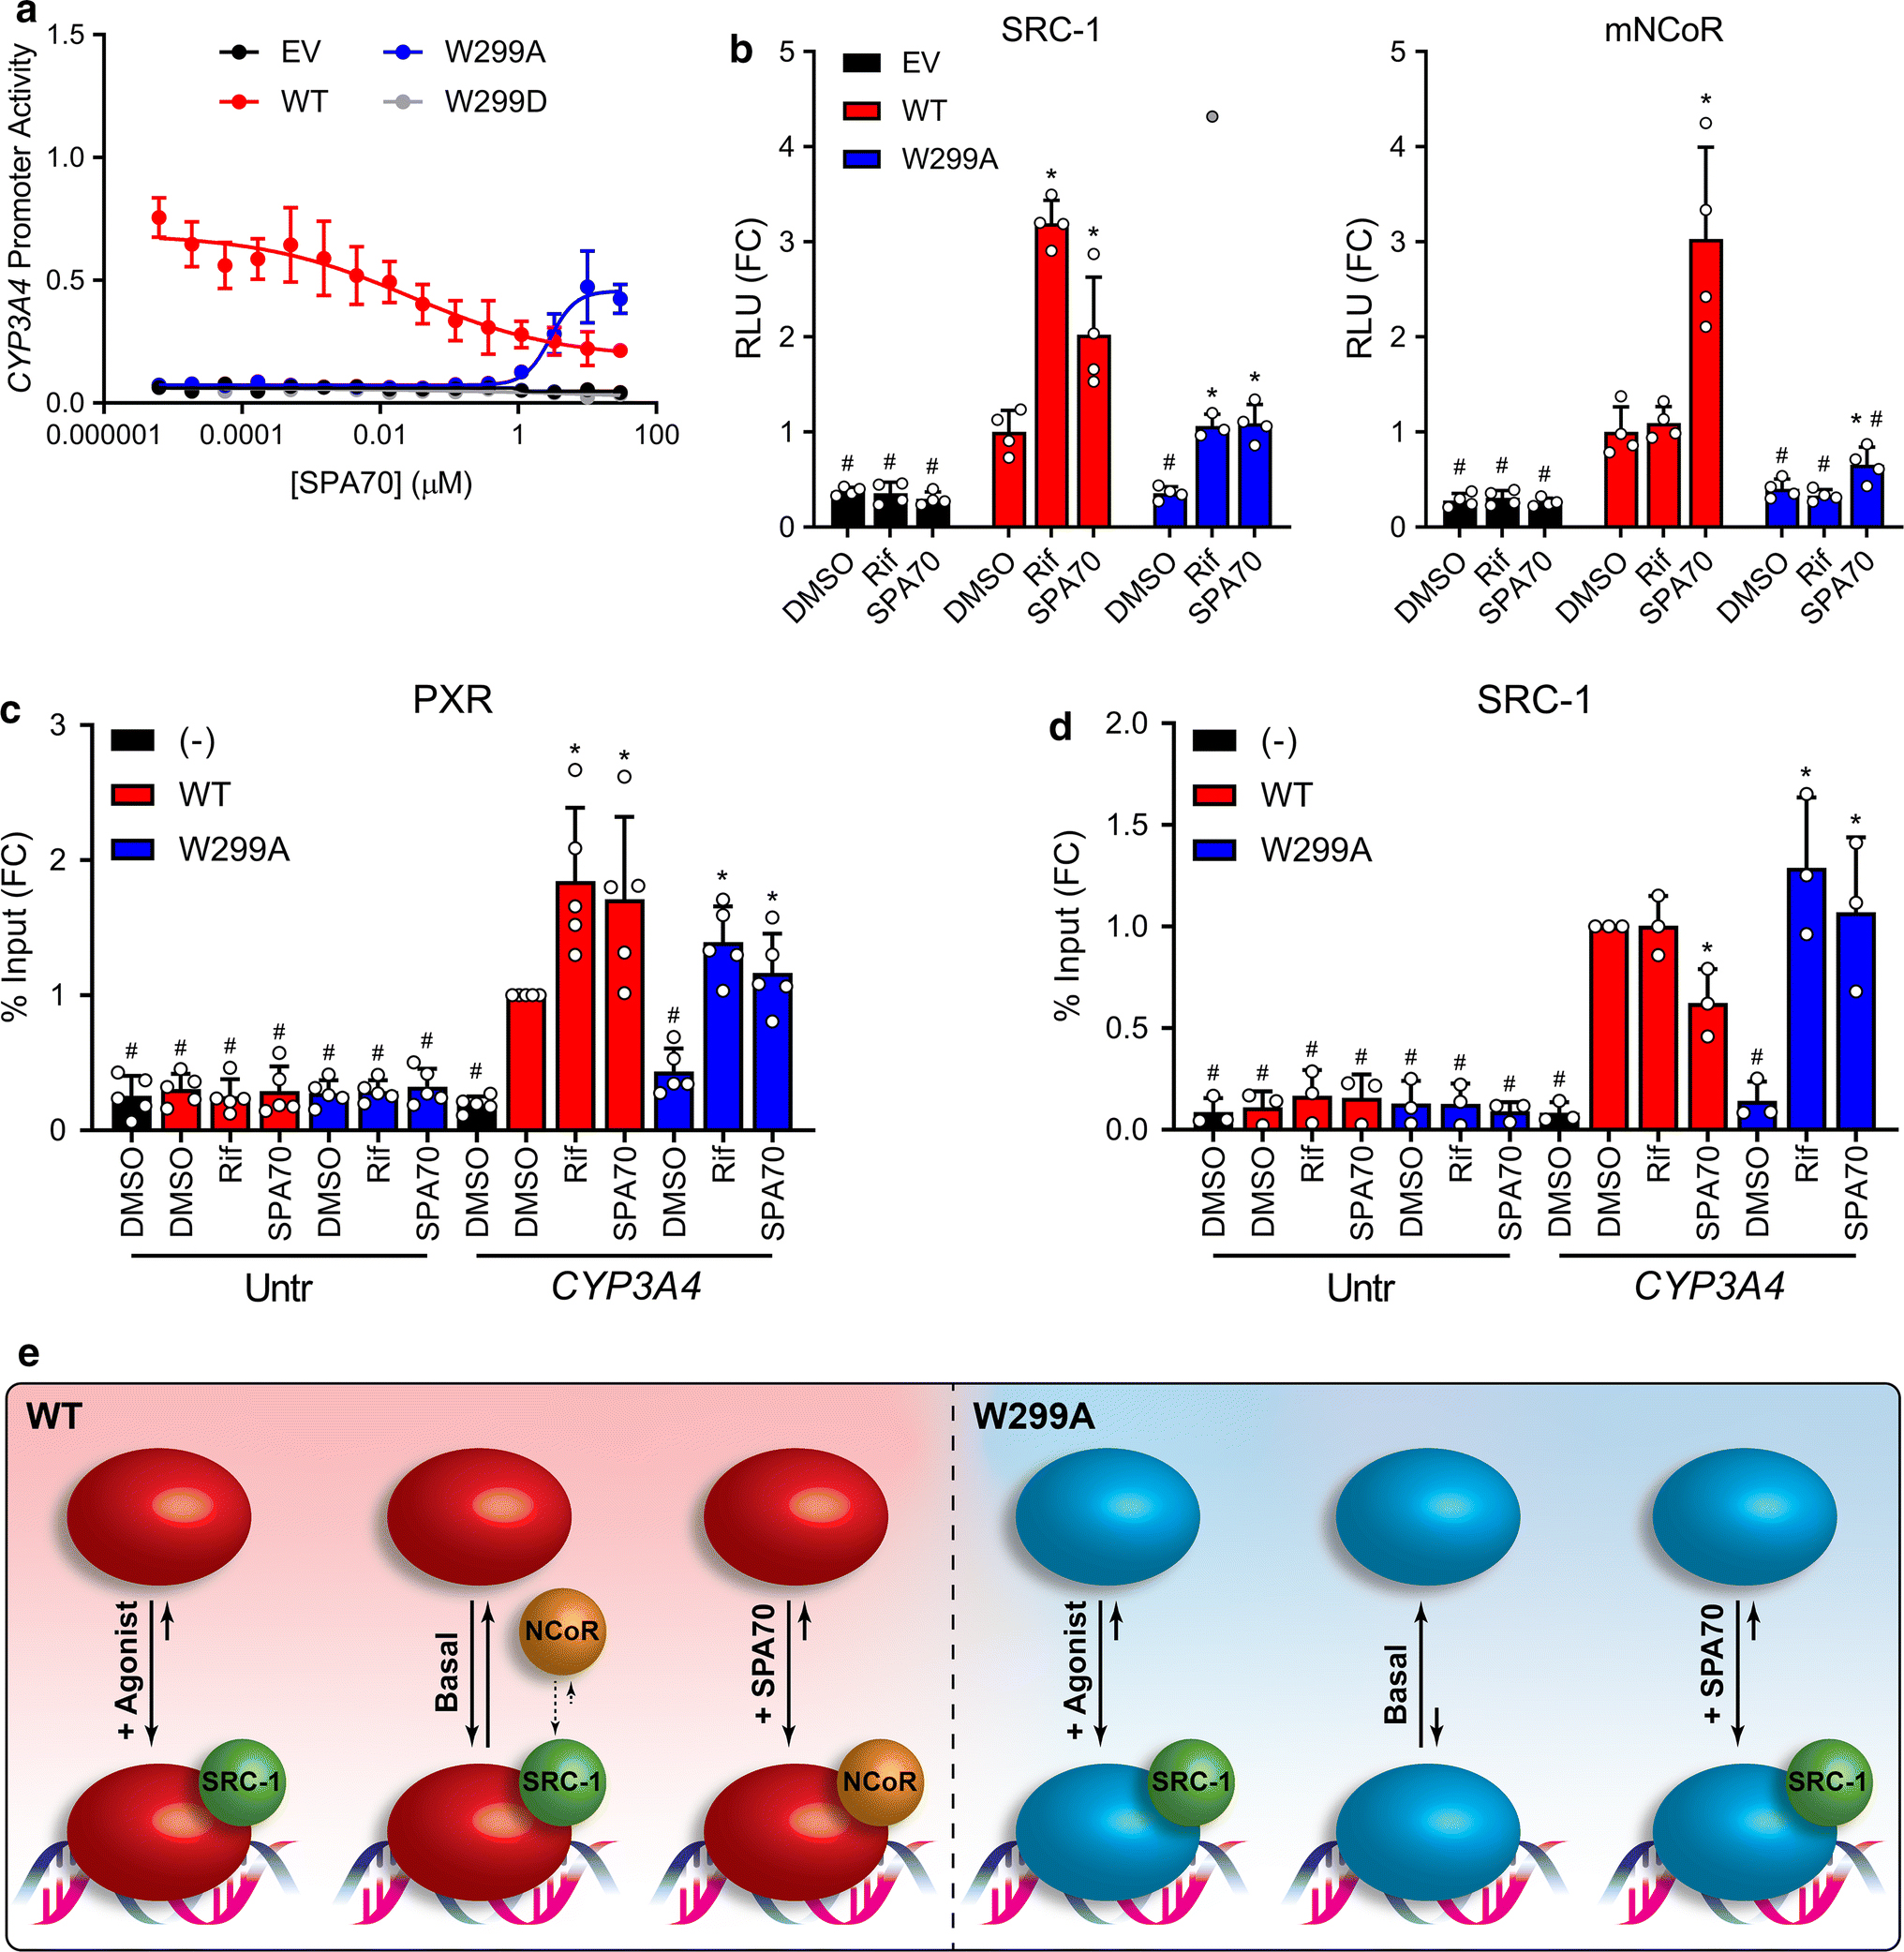
Figure 3. SPA70 is an antagonist of PXR WT but an agonist of PXR W299A.

(a) HepG2 cells were co-transfected with empty vector (EV), WT, W299A, or W299D PXR and a plasmid encoding firefly luciferase under the control of a PXR-responsive CYP3A4 promoter. Cells were treated with SPA70 for 24 h and assayed for luciferase activity. (b) Mammalian two-hybrid assays were performed in HepG2 cells. Cells were co-transfected with an empty pACT vector or pACT-PXR LBD plasmid (WT, W299A, or W299D), a coregulator plasmid (pBIND-SRC-1 or pBIND-mNCoR), and a GAL4 firefly luciferase reporter plasmid. Cells were treated with 10 μM Rif or SPA70 for 24 h and assayed for luciferase activity. The symbols represent measurements from 4 independent experiments. The gray point in the W299A + Rif group of the left panel is an excluded outlier. Data in panels a-b are presented as FC relative to the WT PXR DMSO control. For b, significance was assessed with one-way ANOVA followed by Dunnett’s test for each sample compared to the DMSO control of its group [p ≤ 0.05 (*)] and for each sample compared to the DMSO control for WT PXR [p ≤ 0.05 (#)]. (c) HepG2 cells were transfected with untagged PXR (−) or FLAG-PXR (WT or W299A). Cells were treated with 10 μM Rif or SPA70 for 24 h, and ChIP was performed with anti-FLAG. (d) HepG2 cells were co-transfected with FLAG-PXR plasmid (WT or W299A) and either EV (−) or a plasmid expressing SRC-1. Cells were treated with 10 μM Rif or SPA70 for 24 h, and ChIP was performed with anti-SRC-1. Data for c-d are presented as FC relative to the CYP3A4 qPCR from the WT PXR DMSO sample, and symbols represent measurements from at least 3 independent experiments. For panels c-d, significance was assessed with one-way ANOVA followed by Dunnett’s test for each sample compared to the DMSO control of its group [p ≤ 0.05 (*)] and for each sample compared to the DMSO control for WT PXR CYP3A4 [p ≤ 0.05 (#)] (e) The activities of WT and W299A PXR without ligand (basal), with agonist, and with SPA70 are shown graphically. For each condition, the solid arrow lengths and directions depict the qualitative equilibrium of DNA-bound vs. free PXR, and the spheres show cofactor interactions. The small dashed arrows indicate the equilibrium between SRC-1 and NCoR interactions with PXR under the basal condition; the equilibrium is depicted as preferring SRC-1 due to the basal activity present with WT PXR.
