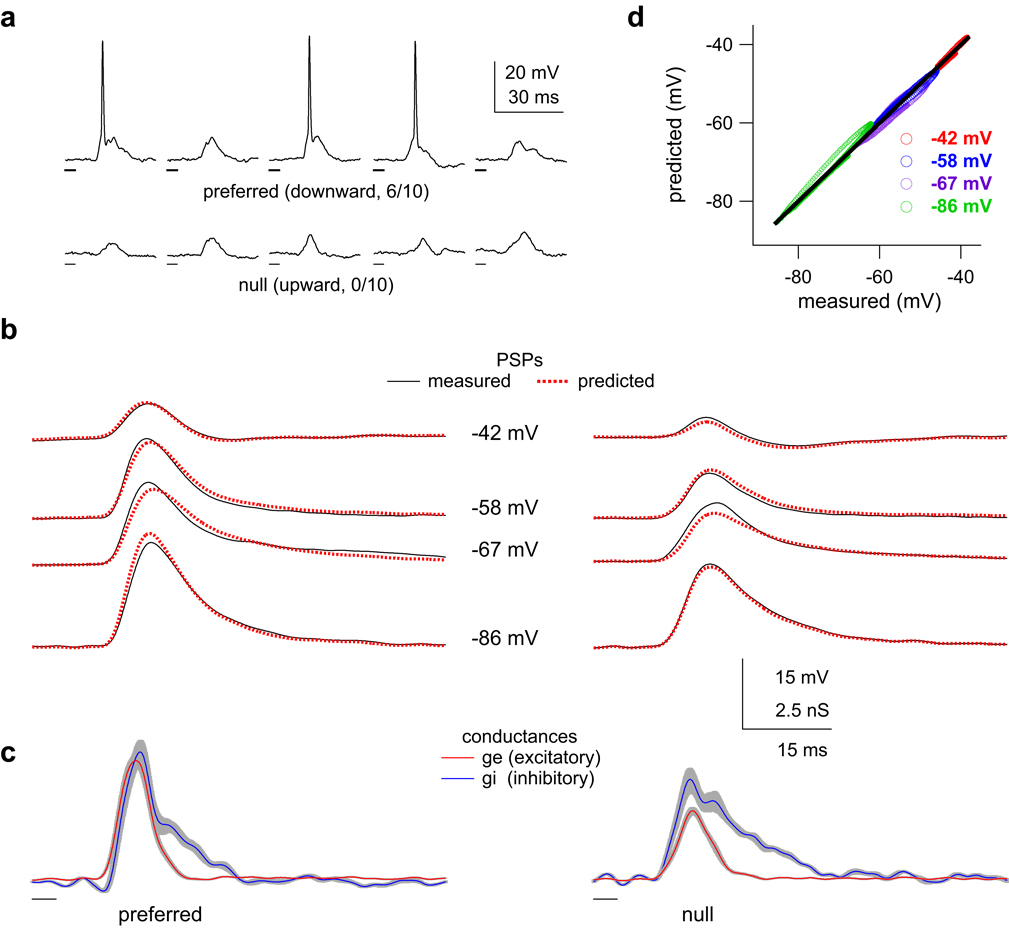
Figure 4. Estimated synaptic conductances predict membrane responses.
(a) Five responses to the preferred and null FMs at rest (RMP = −42 mV). Fraction shows #spikes/#trials, FM times shown below voltage traces. (b) To derive the conductances, we measured voltage responses to preferred and null FMs while the cell was hyperpolarized to different potentials with constant current (black, average of ten trials, spikes filtered from responses at RMP (top row)). Predicted responses (dashed red) from the derived conductances shown in (c) closely match measured responses. (c) Estimated conductance traces derived from the black traces in (b). FM times shown below traces, grey indicates 95% confidence (bootstrapping). (d) Predicted membrane responses closely match the measured membrane responses. Points plotted after the onset of the sound-evoked response. The solid line passes through the origin and has a slope of 1. The estimated conductances account for > 99% of the variance in this example.

