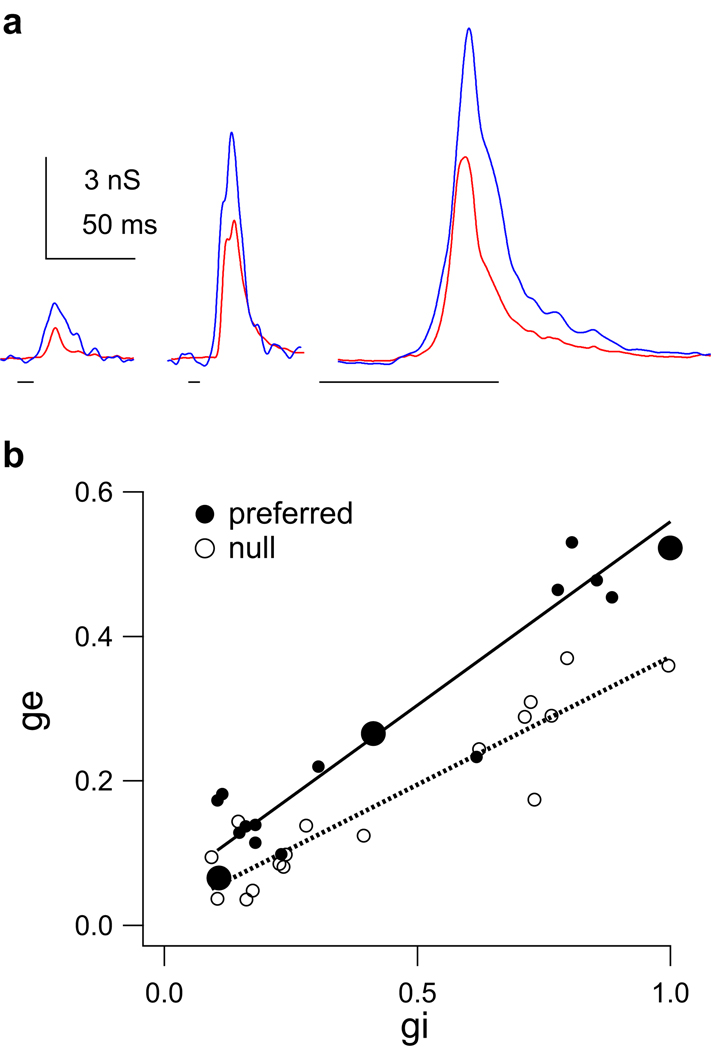
Figure 9. Inhibition scales with excitation.
(a) Three example conductance pairs evoked by the preferred FMs illustrating that excitation and inhibition scale together independent of their absolute magnitudes. (Excitation (ge) red, inhibition (gi) blue.) Conductance pairs correspond to the large filled circles in (b). (b) The magnitude of inhibition evoked by each FM correlated positively with the magnitude of excitation evoked by the same FM, consistent with inhibition acting as a gain control (n = 34, R2 = 0.81, p < 0.01, regression not shown). However, the ratio of conductance magnitudes (excitation/ inhibition) is greater for the preferred FMs (closed circles, solid line) than for the null FMs (open circles, dashed line), indicating that the magnitudes of inhibition were skewed to suppress the null responses (n=17, p = 0.034, ANCOVA).

