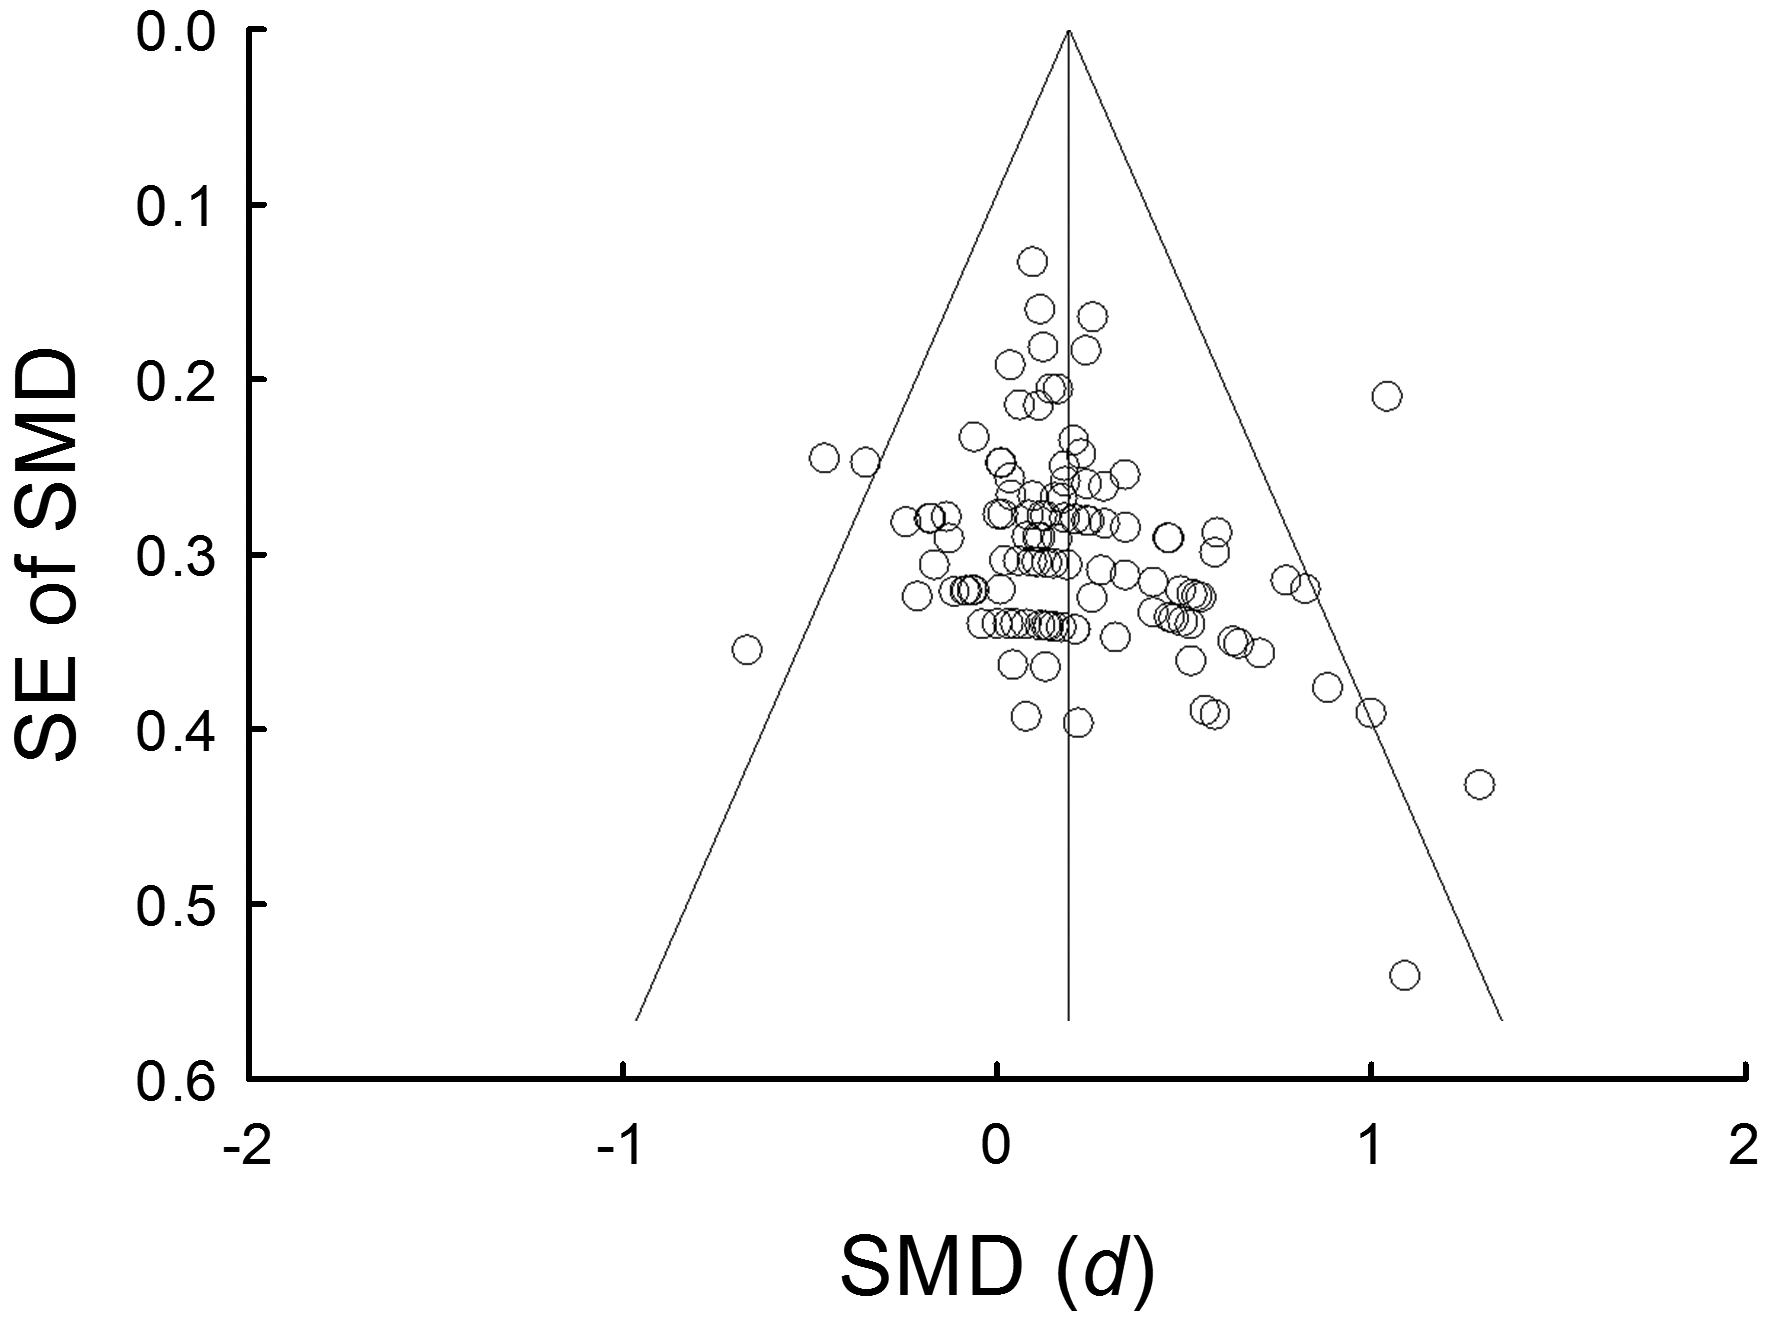
Figure 6.

Funnel plot of the standard error (SE) and standardized effect for each study. The angled lines define the area including the 95% confidence interval (CI) of the standardized mean differences (SMD) and the vertical line defines the middle of the funnel at the mean SMD. Visual inspection of the funnel plot shows three studies fall below 95% CI and three studies are above 95% CI.
