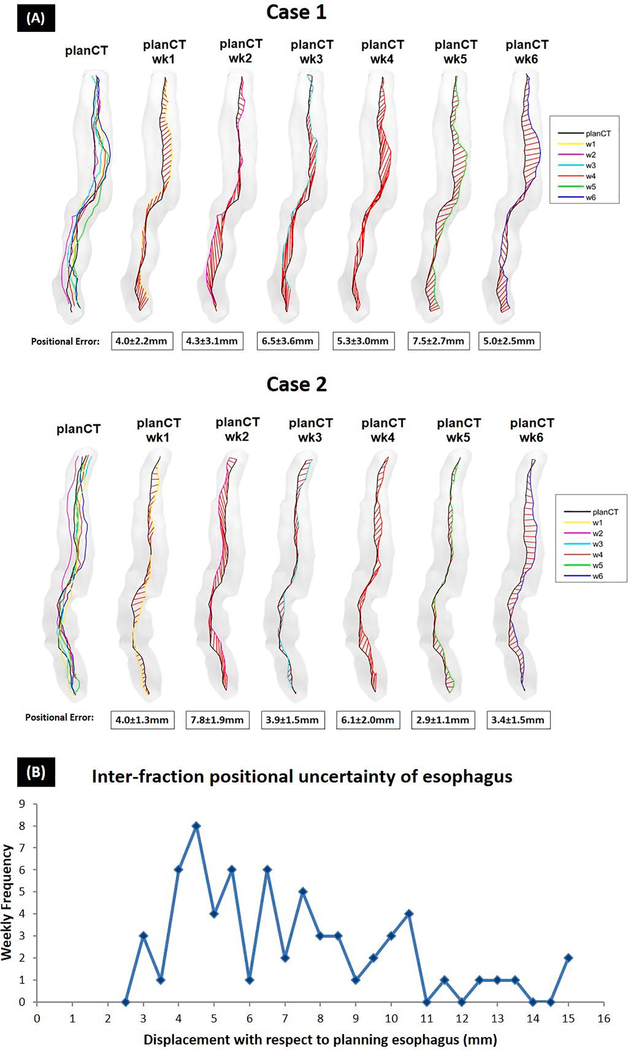
Fig. 3.
(A) Inter-fraction positional uncertainty between pCT and wMRIs esophagus of two typical cases calculated using medial axis. Grade shading structures demonstrate the planning esophagus contour. The black lines in the middle show medial axis of the planning esophagus and the colored lines (yellow for w1 to blue for w6) are the corresponding weekly esophagus medial axes. The red lines in between represent the distance between the corresponding points on the black and the colored medial axes which mean ± SD were calculated. (B) Histogram of displacement of weekly esophagus with respect to the planning esophagus for all the weeks.

