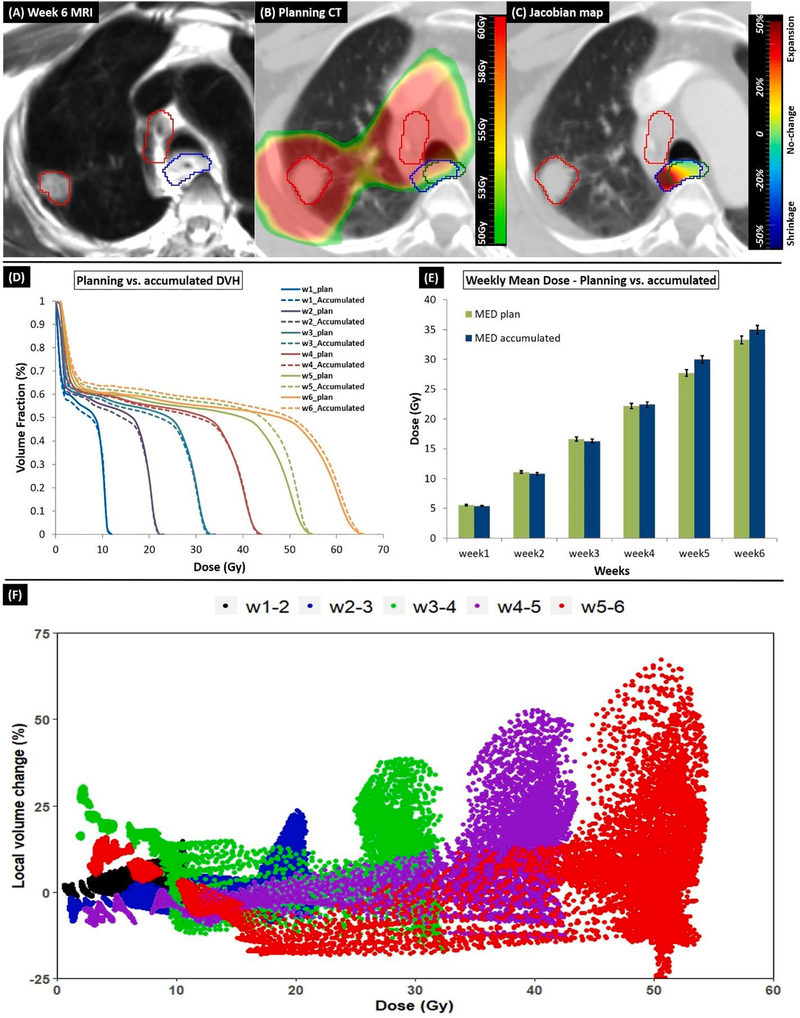
Fig. 4.
(A) Week 6 MRI of a case that developed AE2 at week 5. Blue and red contours are the week 6 esophagus and GTV, respectively. (B) Accumulated week 6 dose map overlaid on pCT. The esophagus contour generated on pCT via DIR (blue) showed local expansion compared to the planning esophagus (green) due to proximity to the GTV (red contour). (C) Jacobian map showed large expansion (D) Planned vs. weekly DVH and (E) Comparing planned and the accumulated MED. Error bars indicates 2% errors for each value. (F) Scatter plot shows voxel-wise correlation between accumulated dose and the local volumetric change in esophagus calculated using wMRIs. (For interpretation of the references to colour in this figure legend, the reader is referred to the web version of this article.)

