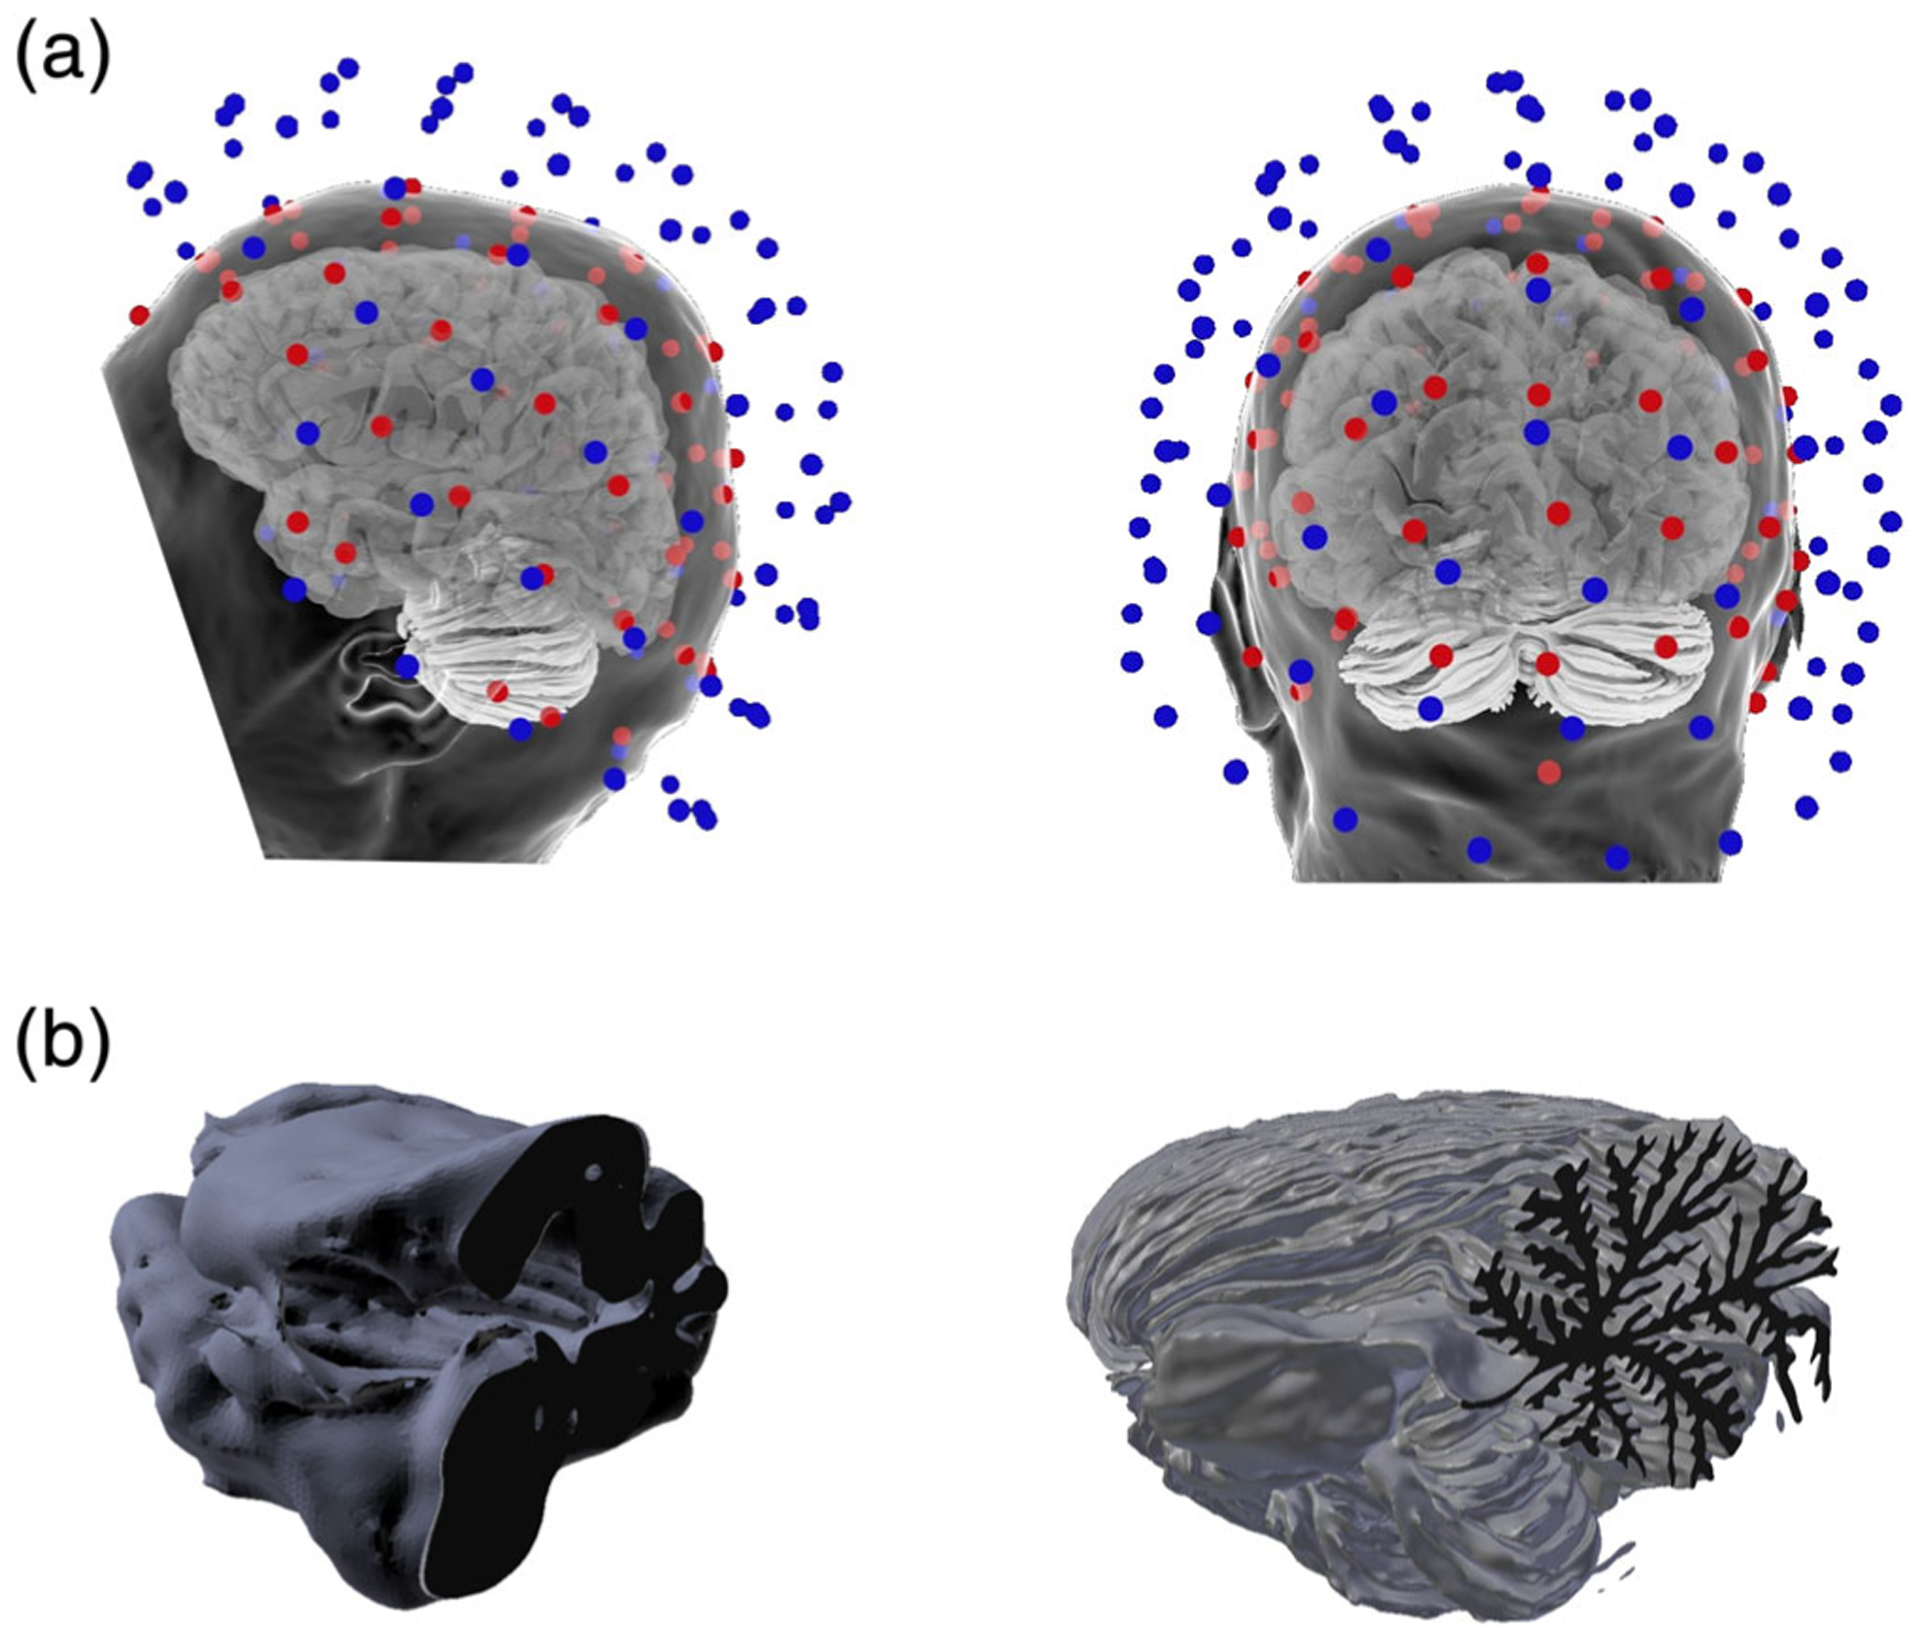
FIGURE 1.

(a) The MEG and EEG sensor arrays with the head surface and cortical and cerebellar source reconstructions. The MEG sensors are colored blue to distinguish them from the EEG sensors (red) and the head surface is translucent to allow for viewing of the cerebellum and cortex in relation to the sensor arrays. (b) Sagittal plane cross-section of the cerebellar vermis of the standard FreeSurfer tessellation of the cerebellum (left) and the detailed model used in this study (right)
