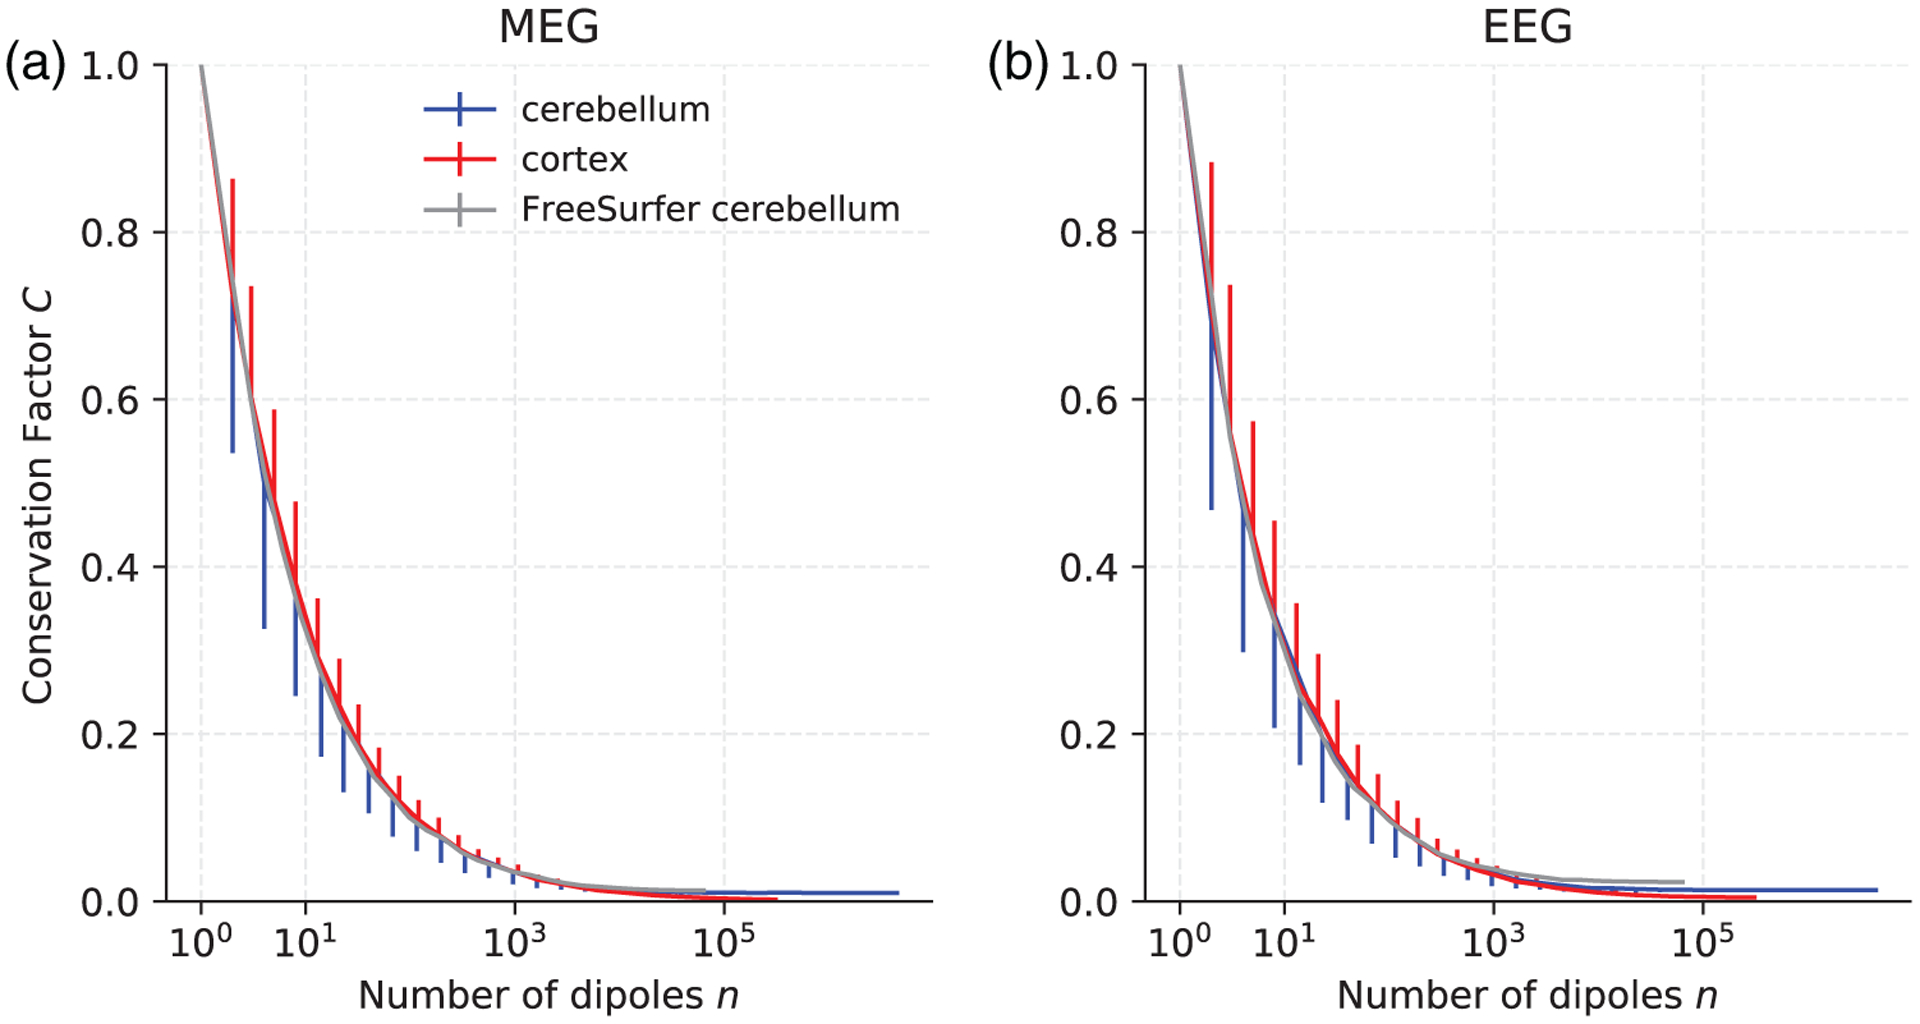
FIGURE 2.

Conservation factor C as a function of the number of randomly distributed current dipoles in the cortex (red), the high-resolution cerebellum model (blue), and the FreeSurfer cerebellum model (gray) for MEG magnetometers (left) and EEG (right). For each n, the mean conservation factor is plotted. The bars represent one standard deviation and are plotted one-sided only for clarity
