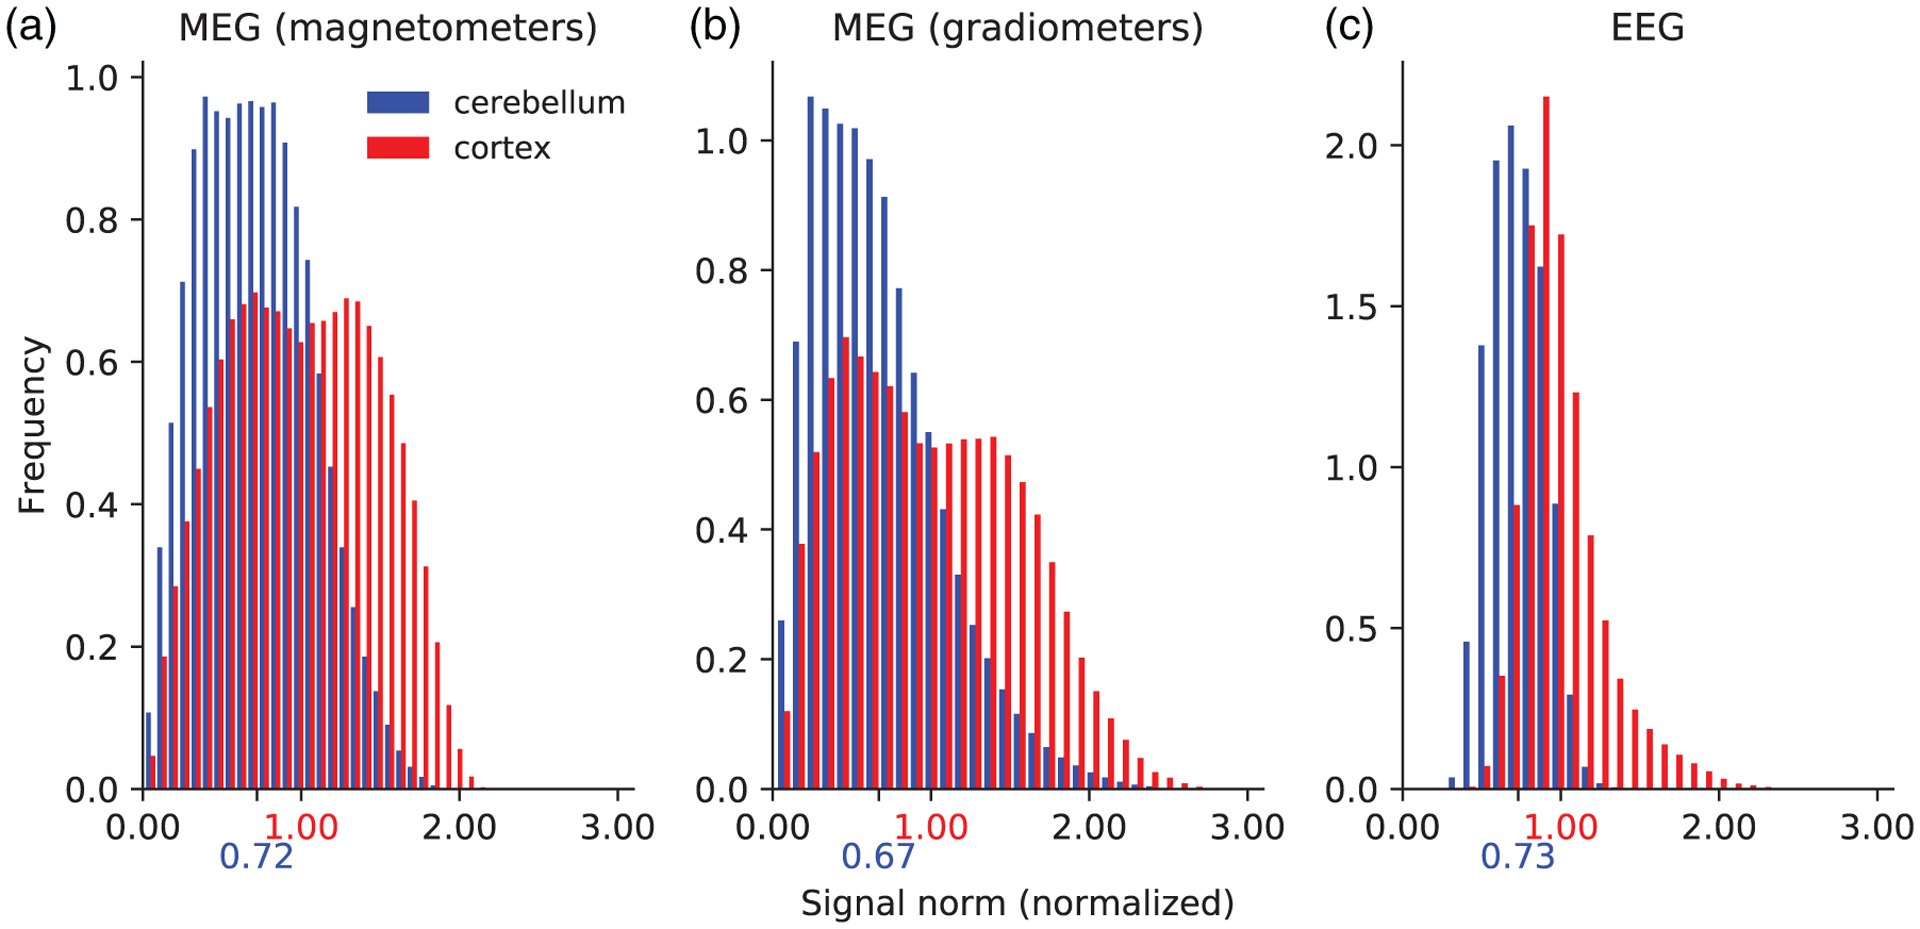
FIGURE 4.

Histogram plots of the signal norm from individually activated dipoles in the cerebellum and cortex for MEG magnetometers (a), MEG gradiometers (b), and EEG (c). The signal norms were normalized to the median cortical signal norm, marked on the x-axis in red. The median cerebellar signal norms are marked on the x-axis in blue. The distributions were normalized so that the integral of each distribution equals one
