
FIGURE A1.
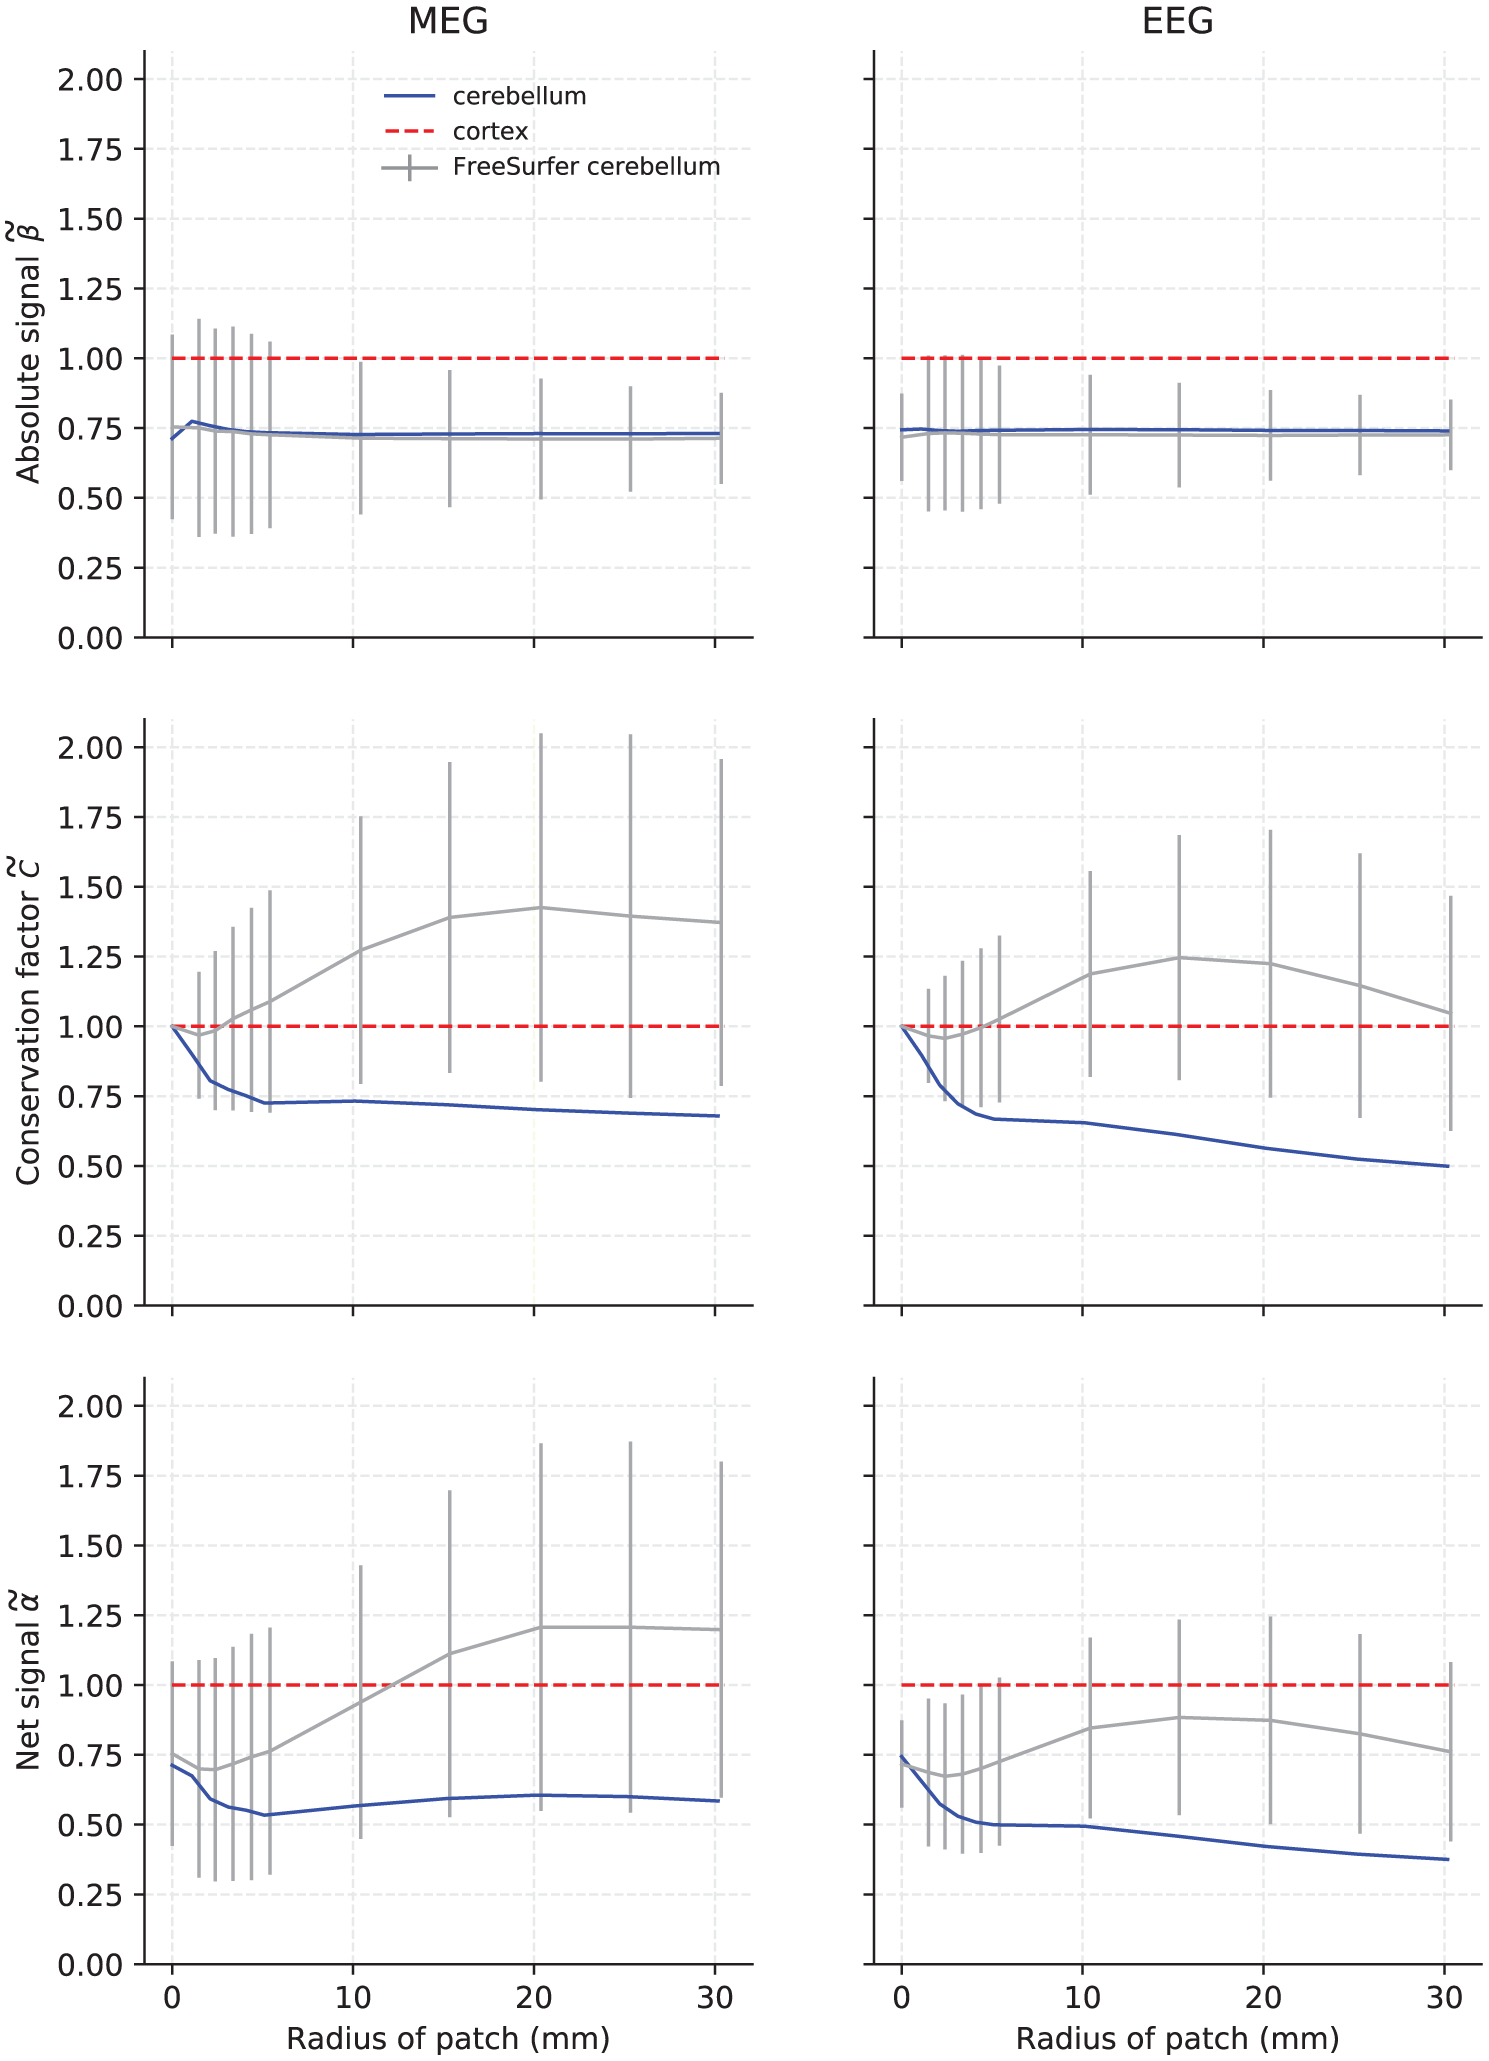
Absolute Euclidean signal norm (top row), conservation factor (middle row), and net Euclidean signal norm (bottom row) for MEG magnetometers (left column) and EEG electrodes (right column) from 200 samples of varying activated patch sizes in the low-resolution FreeSurfer cerebellum (gray). The solid line represents the median value and the error bars plus/minus one standard deviation. The median values for the high-resolution cerebellum model (blue) have been added for reference. All data were normalized to the mean of the cortical conservation factor or signal norm (dashed red line)