
Fig. 3. HPA axis metric associations with AUD associated DNA methylation.
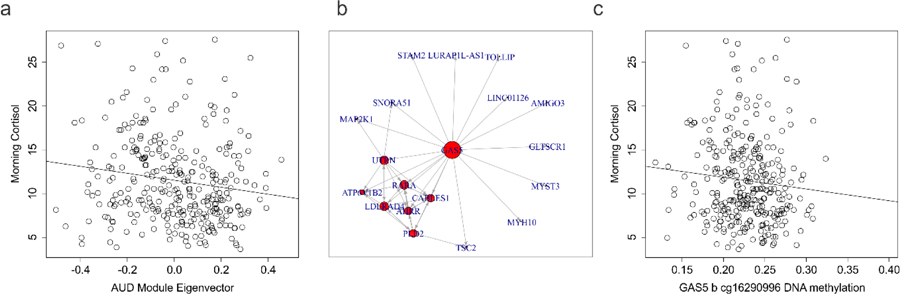
a) Scatterplot of morning cortisol (y axis) as a function of AUD associated coregulated module eigenvector values (x axis). b) Network diagram from the network mediation analysis demonstrating co-regulated genes associated with morning cortisol in the discovery dataset. c) Scatterplot of morning cortisol (y axis) as a function of GAS5b DNA methylation (x axis).