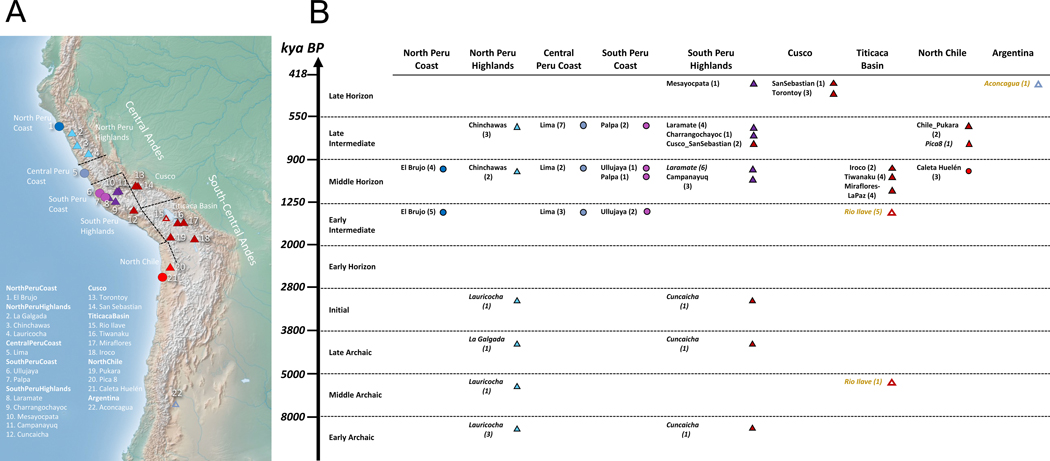
Figure 1. Distribution of Pre-Hispanic Individuals Over Space and Time.
(A) Map with the locations of 86 ancient individuals (3 from our study are not included here due to very low coverage). Dotted lines represent regions defined for this study. Highland individuals are triangles and Coast individuals are circles. Coloring corresponds to genetic profiles, which in most cases match the geographic regions. (B) Groupings of ancient individuals based on geography and archaeological period (Table S1). Italics indicate previously published individuals, and sample sizes are in parentheses (yellow indicates shotgun sequences). Map was made with Natural Earth.

