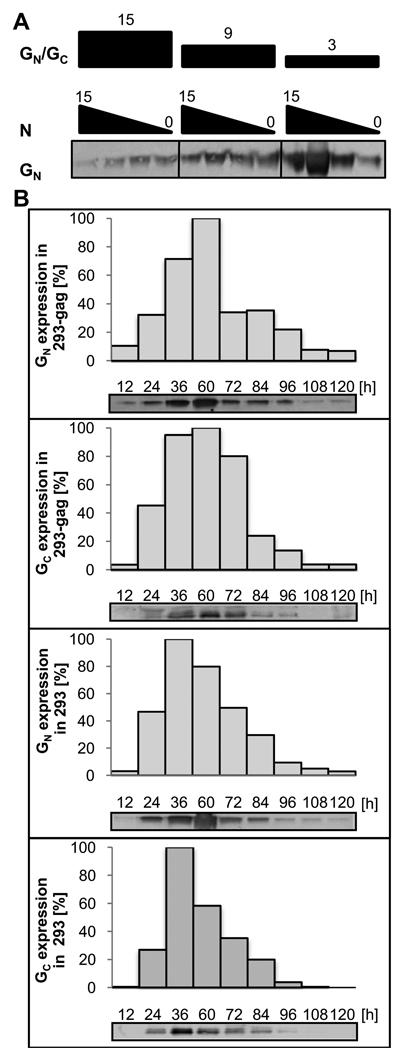
Figure 2. Optimization of RVF VLP production.
A) Different plasmid ratios to determine optimal chimeric RVF VLP production: 293-gag cells were transfected with 15, 9 or 3µg of the RVFV G expression plasmid, and co-transfected with 0, 3, 9 or 15µg RVF N expression plasmid as indicated. Concentrated supernatants of a 60 h post transfection harvest were analyzed by Western blot using antibodies specific for RVFV GN. B) Time course experiment to optimize RVF VLP yields: Western blot analysis was performed using antibodies specific for RVFV GN and GC, as indicated at each blot of RVF chimVLPs and VLPs harvested at select times post-transfection. Densitometric analysis of band intensity, displayed as % maximum band intensity for a particular blot, is represented by histograms above each Western blot. Harvest times are indicated.

