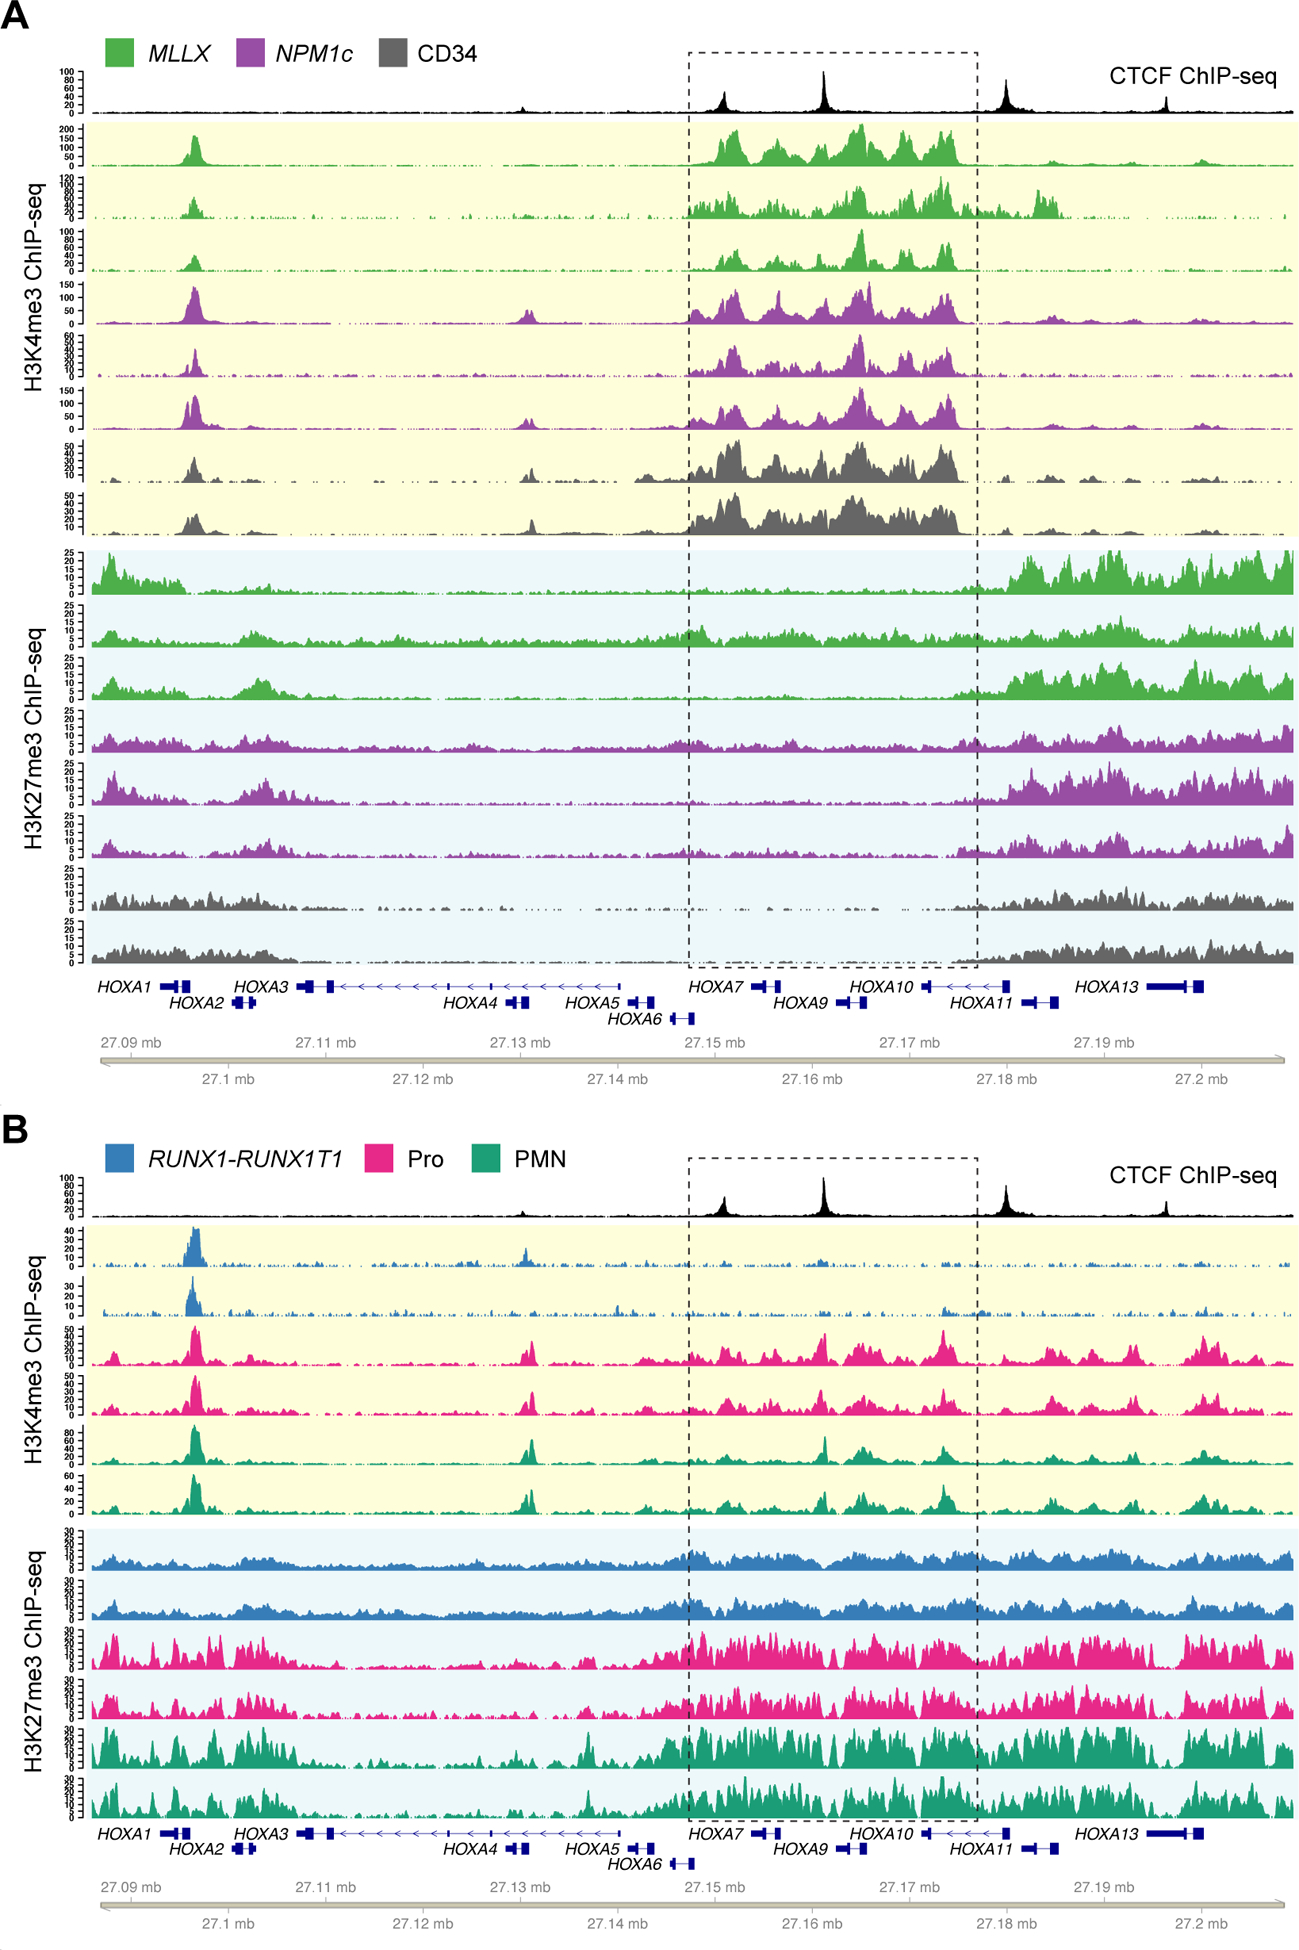
Figure 2. CTCF defines chromatin boundaries in AML samples and normal CD34+ cells with HOXA gene expression.

A. Top track shows CTCF ChIP-seq from a NPM1-mutant primary AML sample. Tracks highlighted in yellow show ChIP-seq for H3K4me3 from primary samples with high HOXA expression, including AML samples with MLL rearrangements (green; N=3) and NPM1 mutations (purple; N=3), and primary CD34+ hematopoietic stem/progenitor cells (HSPCs) purified from normal donor bone marrow samples (gray; N=2, from GSE104579). Tracks highlighted in blue show H3K27me3 ChIP-seq from the same set of samples. B. H3K4me3 and H3K27me3 ChIP-seq from primary samples with no HOXA expression, including AML samples with t(8;21) creating the RUNX1-RUNX1T1 fusion (blue; N=2), and normal promyelocytes (CD14-, CD15+, CD16 low; magenta, N=2) and neutrophils (CD14-, CD15+, CD16 high; cyan, N=2) from healthy donor individuals. Dashed box indicates the region of dynamic chromatin that correlates with HOXA gene cluster expression.
