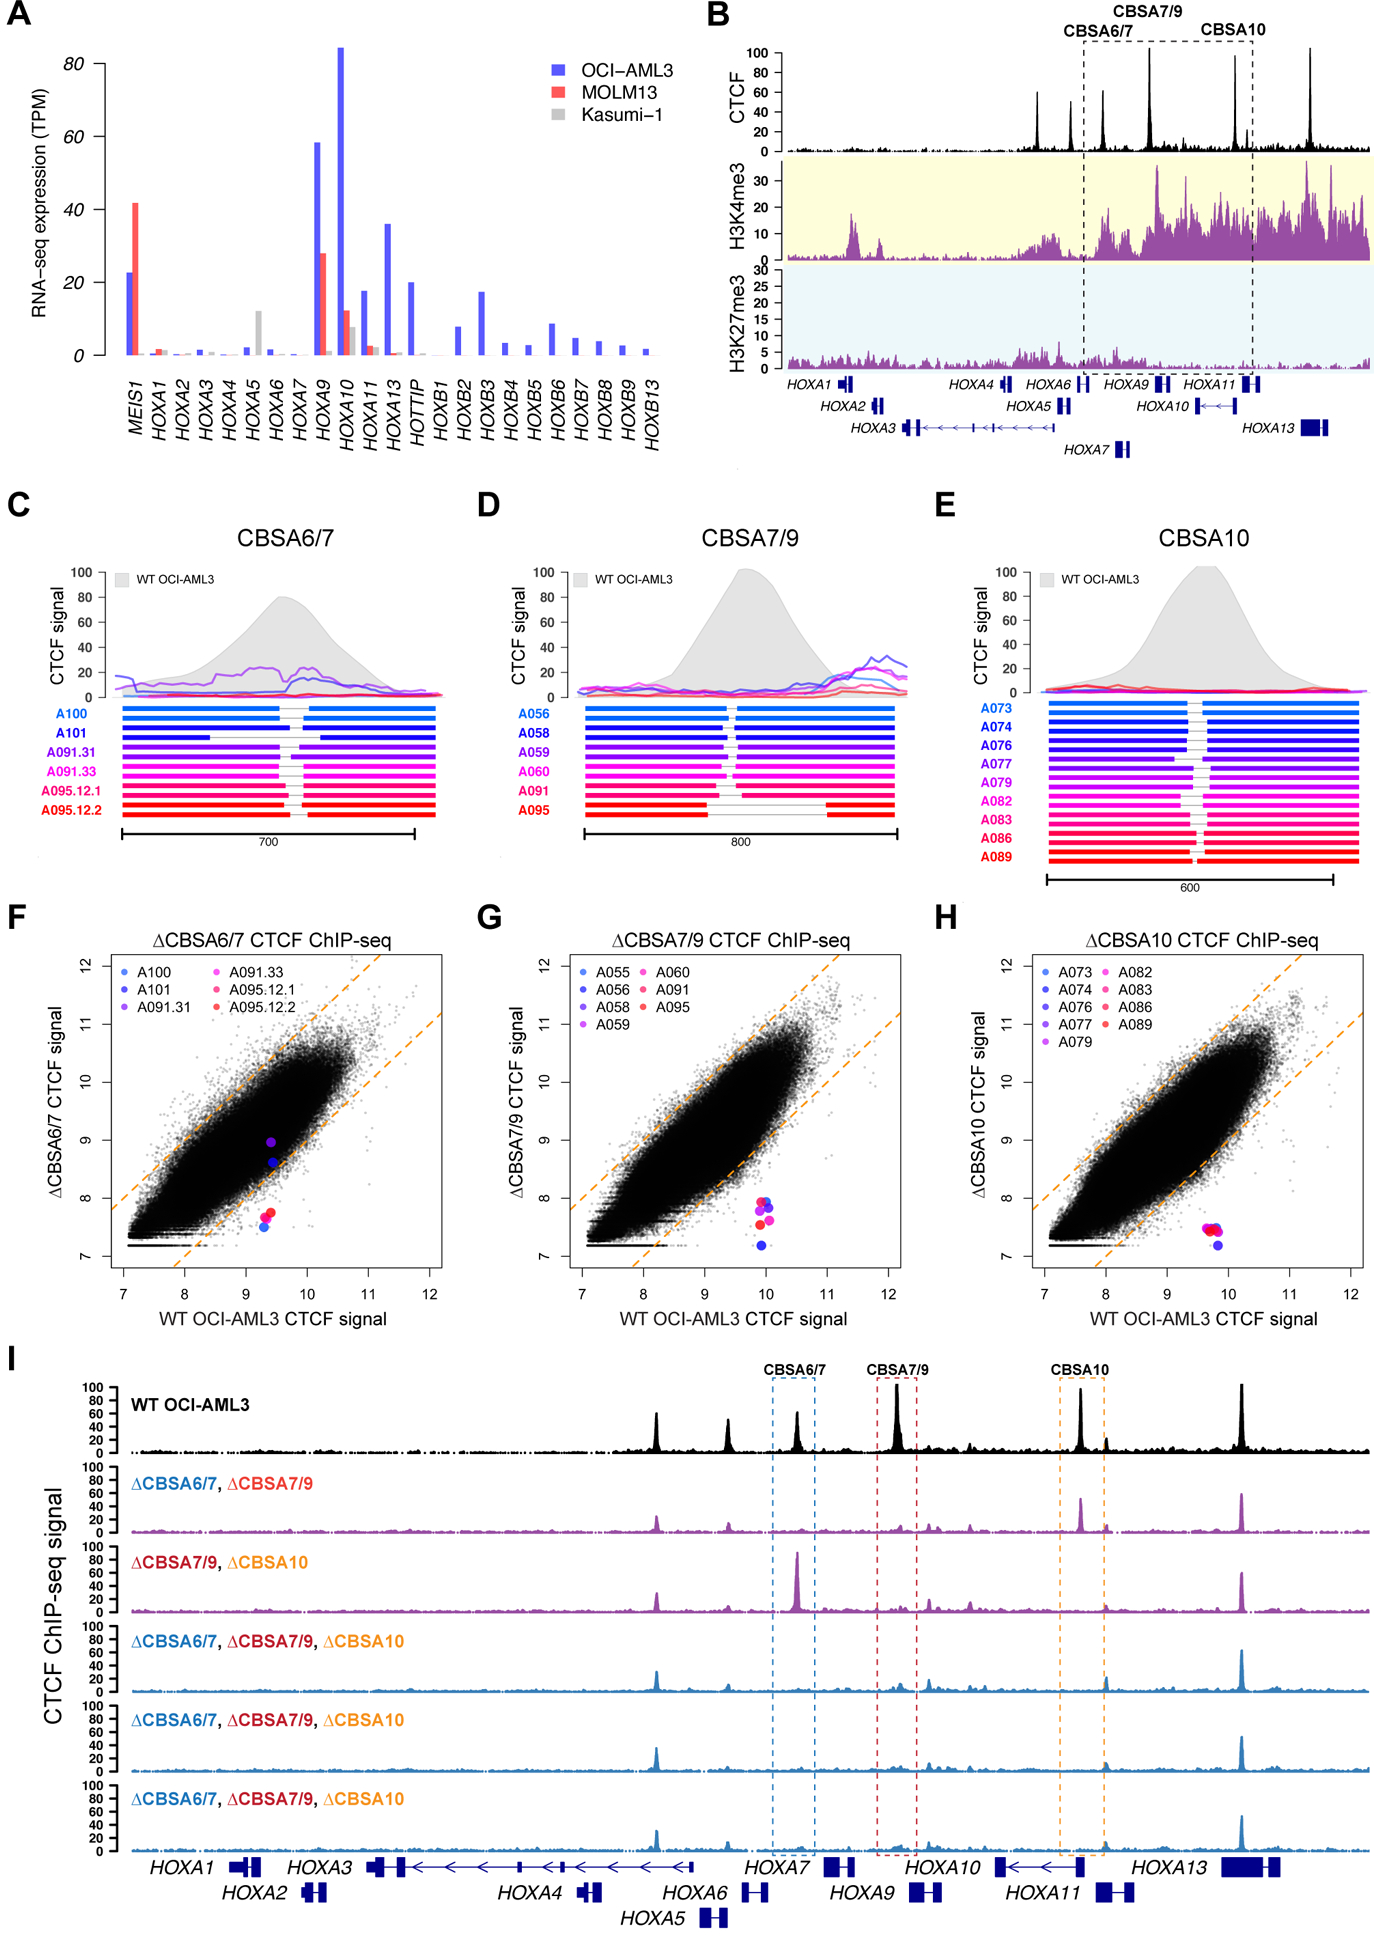
Figure 3. Targeted deletions eliminate CTCF binding in the NPM1-mutant OCI-AML3 cell line.

A. RNA-seq expression of HOXA and HOXB genes in OCI-AML3 cells, which display the canonical mutant NPM1-associated HOXA/HOXB expression phenotype. Also shown are the MLL-rearranged MOLM13 cell line that expresses only HOXA genes, and the RUNX1-RUNX1T1-containing Kasumi-1 cell line that has low HOXA and HOXB gene expression. B. ChIP-seq data from OCI-AML3 cells for CTCF (black), H3K4me3 (highlighted in yellow) and H3K27me3 (highlighted in blue), which show conserved CTCF binding sites and distinct regions of active (H3K4me3) and repressed (H3K27me3) chromatin. C-E. Targeted deletions that disrupt CTCF binding in OCI-AML3 cells at sites CBSA6/7 (in C), CBSA7/9 (in D), and CBSA10 (in E). Bottom panels show allele pairs from homozygous or compound heterozygous deletion mutants at each site; top panels show CTCF ChIP-seq signal from these mutant cell lines (multi-colored lines) compared to wild type OCI-AML3 cells (in gray). F-H. CTCF ChIP-seq signal (log2 normalized read counts) for all CTCF peaks from deletion mutants (Y axis) vs. wild type OCI-AML3 cells, showing dramatically reduced CTCF ChIP-seq signal in deletion mutants at all three sites, with the exception of clones A101 and A091.31, which only partially eliminates CTCF signal at site CBSA6/7. I. CTCF ChIP-seq tracks from double (in purple) and triple mutants (in blue), generated via sequential targeted deletion experiments. CTCF ChIP-seq from wild type OCI-AML3 cells is shown in black at the top for reference.
