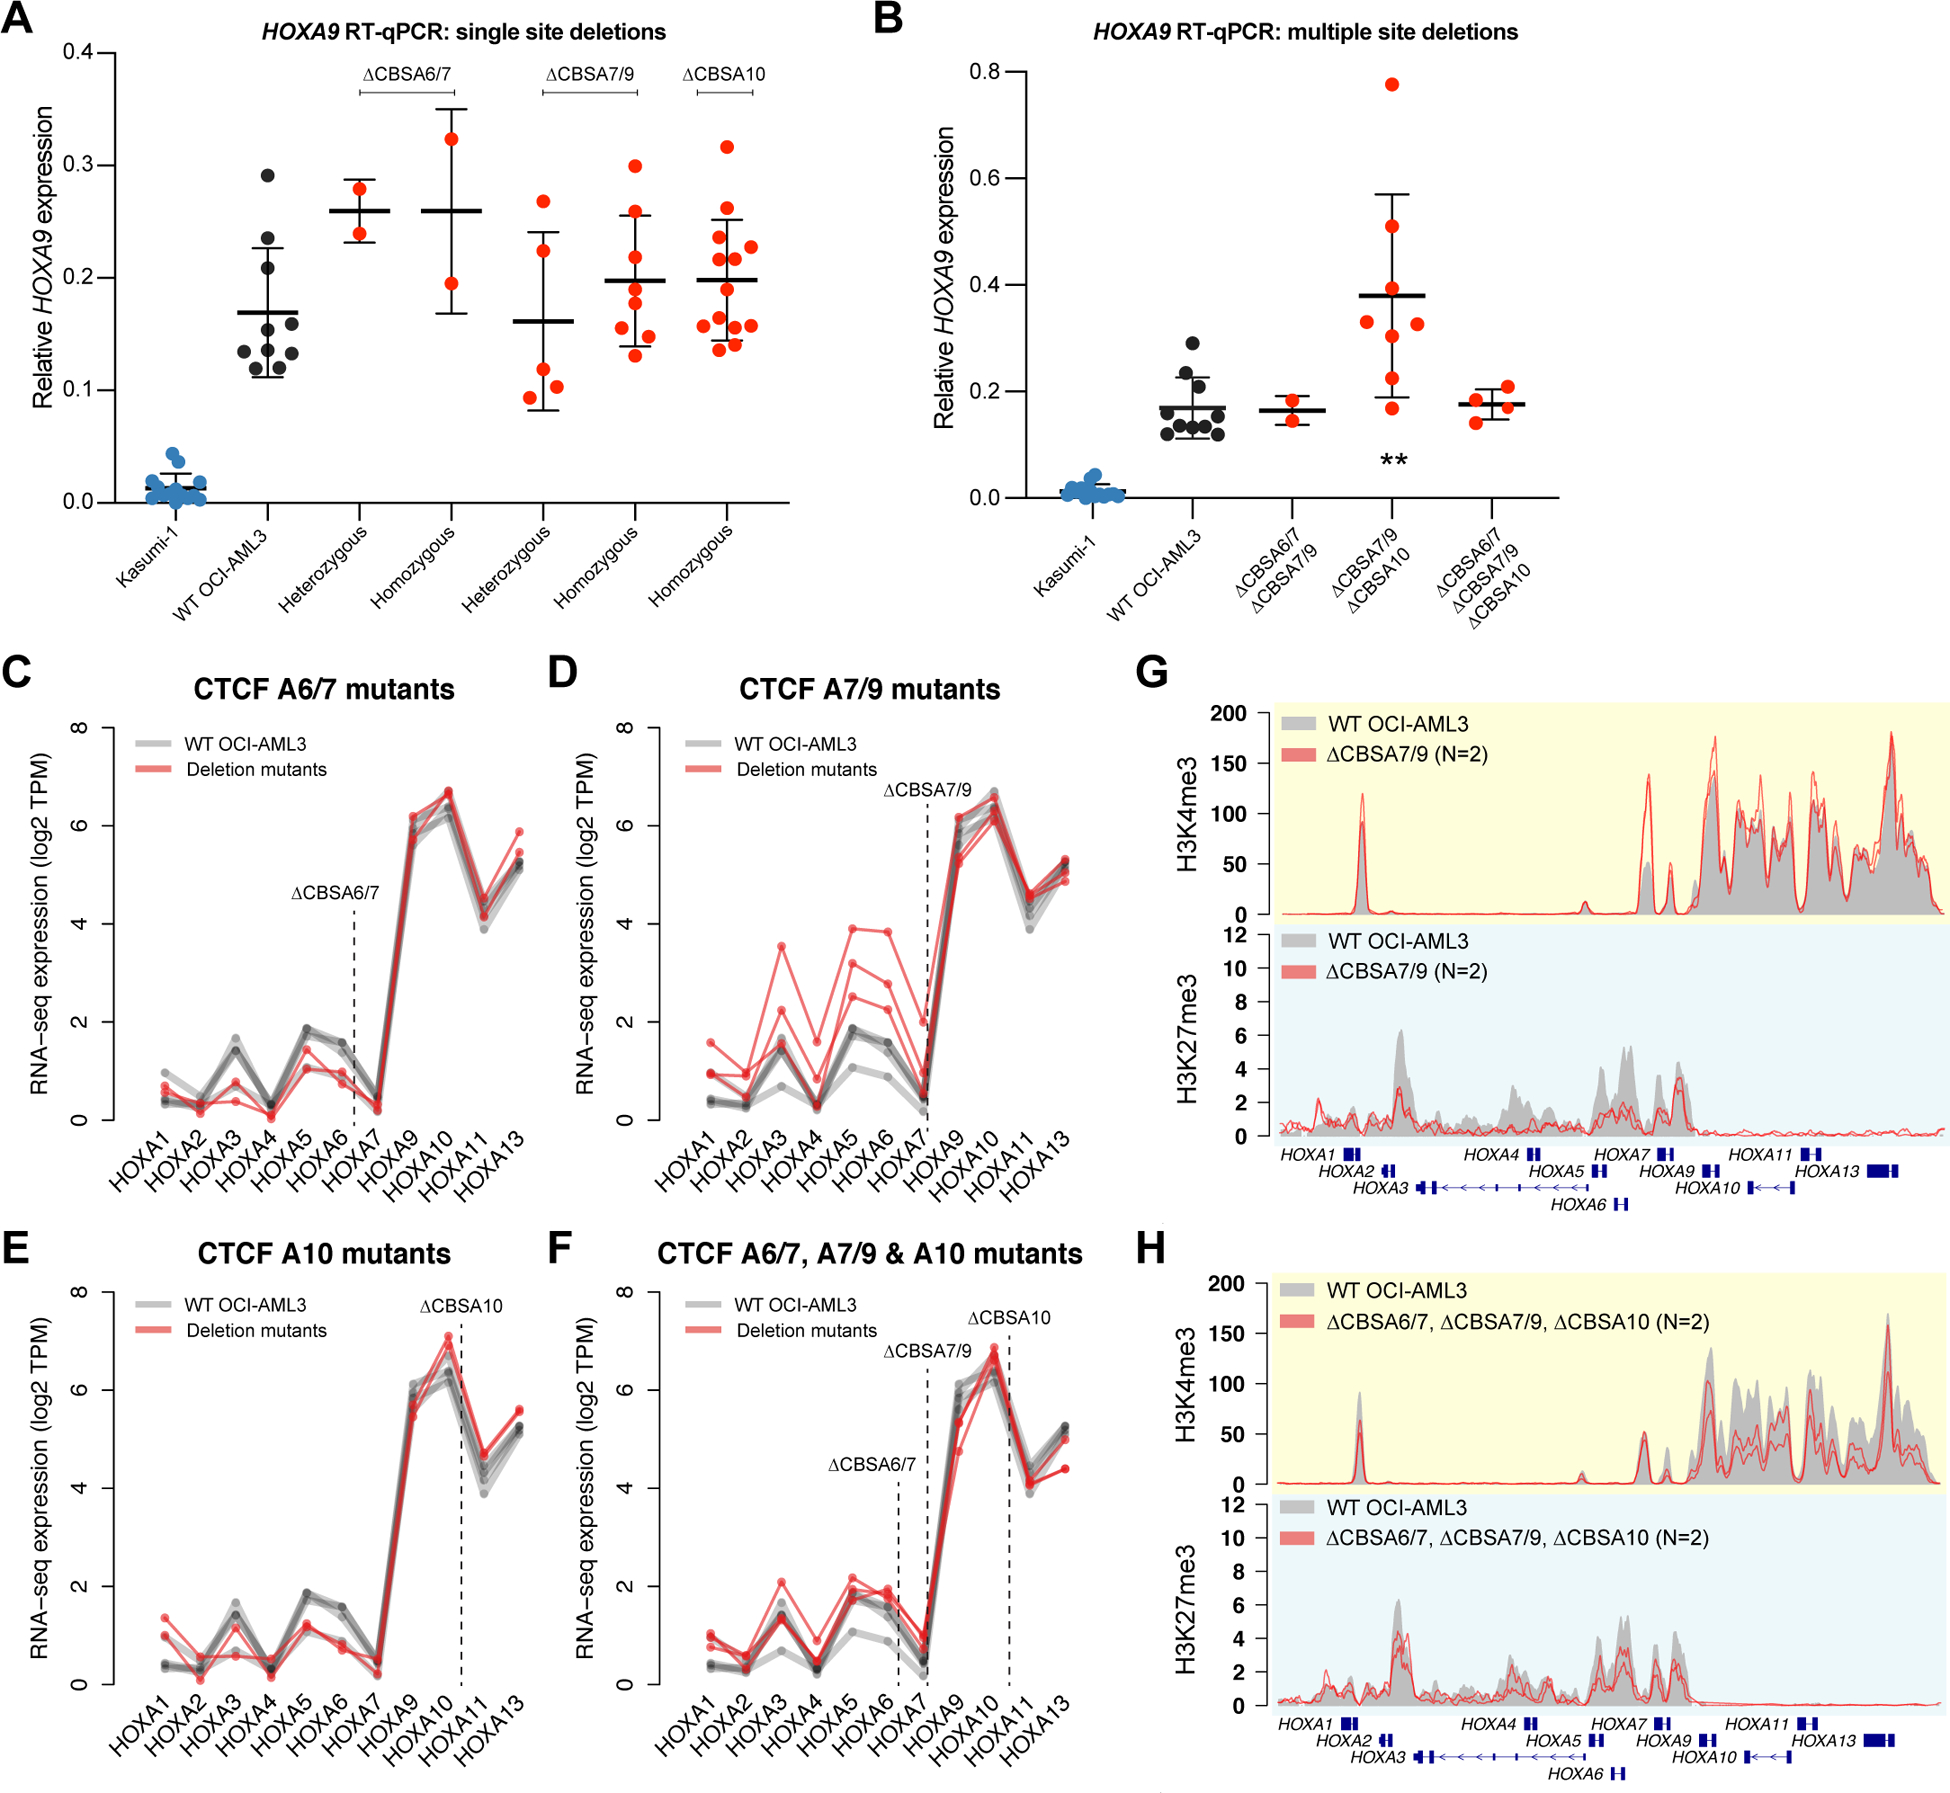
Figure 4. CTCF binding is not required to maintain gene expression or chromatin boundaries in the HOXA gene cluster.

A. RT-qPCR for HOXA9 in single mutants with heterozygous or homozygous deletions at CBSA6/7, CBSA7/9, or CBSA10. HOXA9 expression from the Kasumi-1 cell line is shown in blue as a no-HOXA9 expressing control. No statistically significant differences were identified between wild type OCI-AML3 and homozygous mutants (Bonferroni-corrected P>0.05 using a two-sided unpaired T-test for all comparisons). B. RT-qPCR for HOXA9 in double and triple mutants at the CTCF binding sites indicated. Kasumi-1 cells are included in blue as in panel A. ** denotes a Bonferroni-corrected P<0.01 between wild type OCI-AML3 and CBSA7/9-CBSA10 double mutant clones using a two-sided unpaired T-test. C-F. RNA-seq expression of all HOXA genes in single mutants (C-E) and triple mutants (D). Expression level is shown in log2 transcripts per million (TPM), with lines connecting expression values derived from the same mutant clones and/or the same RNA-seq experiment (for wild type OCI-AML3 cells). G. ChIP-seq for H3K4me3 and H3K27me3 in deletion mutants lacking CTCF at site CBSA7/9 (in red; N=2). Mean ChIP-seq signal from wild type OCI-AML3 cells (N=2) is shown in gray. H. Mean ChIP-seq for H3K4me3 and H3K27me3 in triple mutants (N=2), with ChIP-seq from wild type cells shown in gray, as in panel G.
