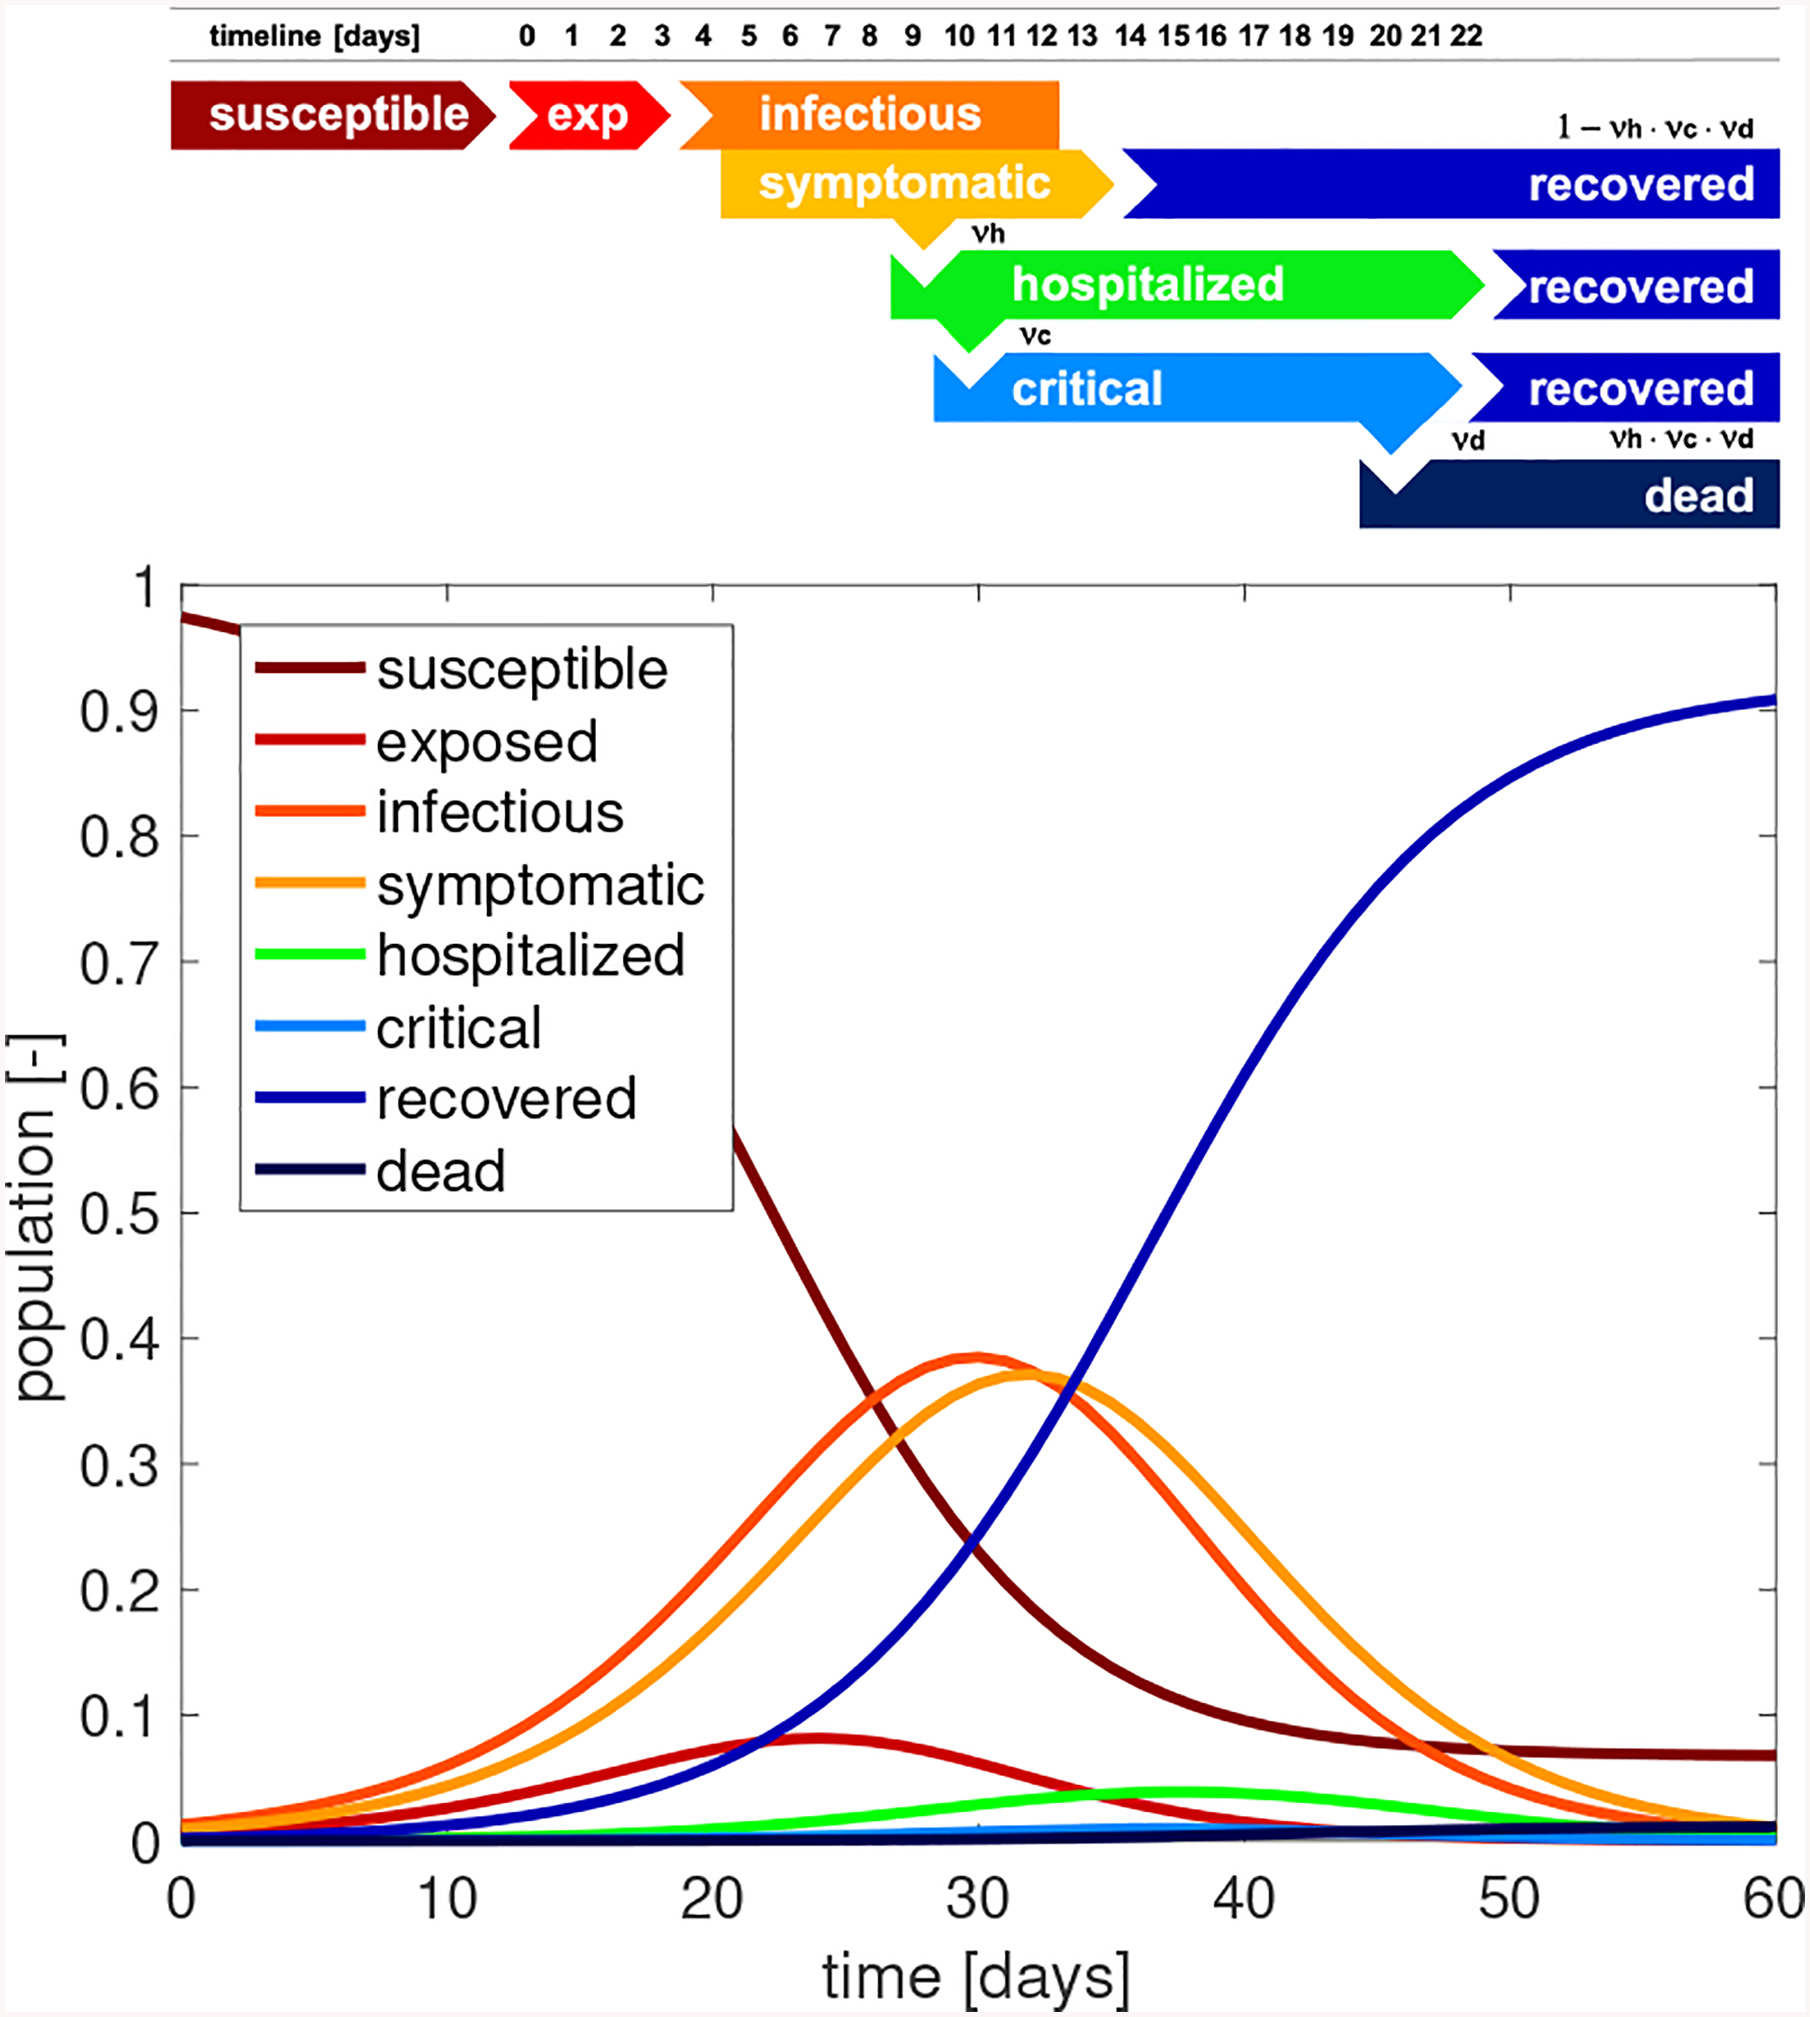
Fig. 1. Typical timeline of COVID-19.

At day 0, a fraction of the susceptible population is exposed to the virus. At day 3, exposed individuals become infectious, and the infectious period lasts for 10 days. At day 5, infectious individuals become symptomatic; the majority of the symptomatic population recovers after 9 days. At day 9, a fraction of the symptomatic population is hospitalized; the majority of the hospitalized population recovers after 14 days. At day 10, a fraction of the hospitalized population experiences critical conditions that last for 10 days and end in either recovery or in death. On the population level, the outbreak of COVID-19 can be summarized in eight curves that illustrate the dynamics of the individual subgroups.
