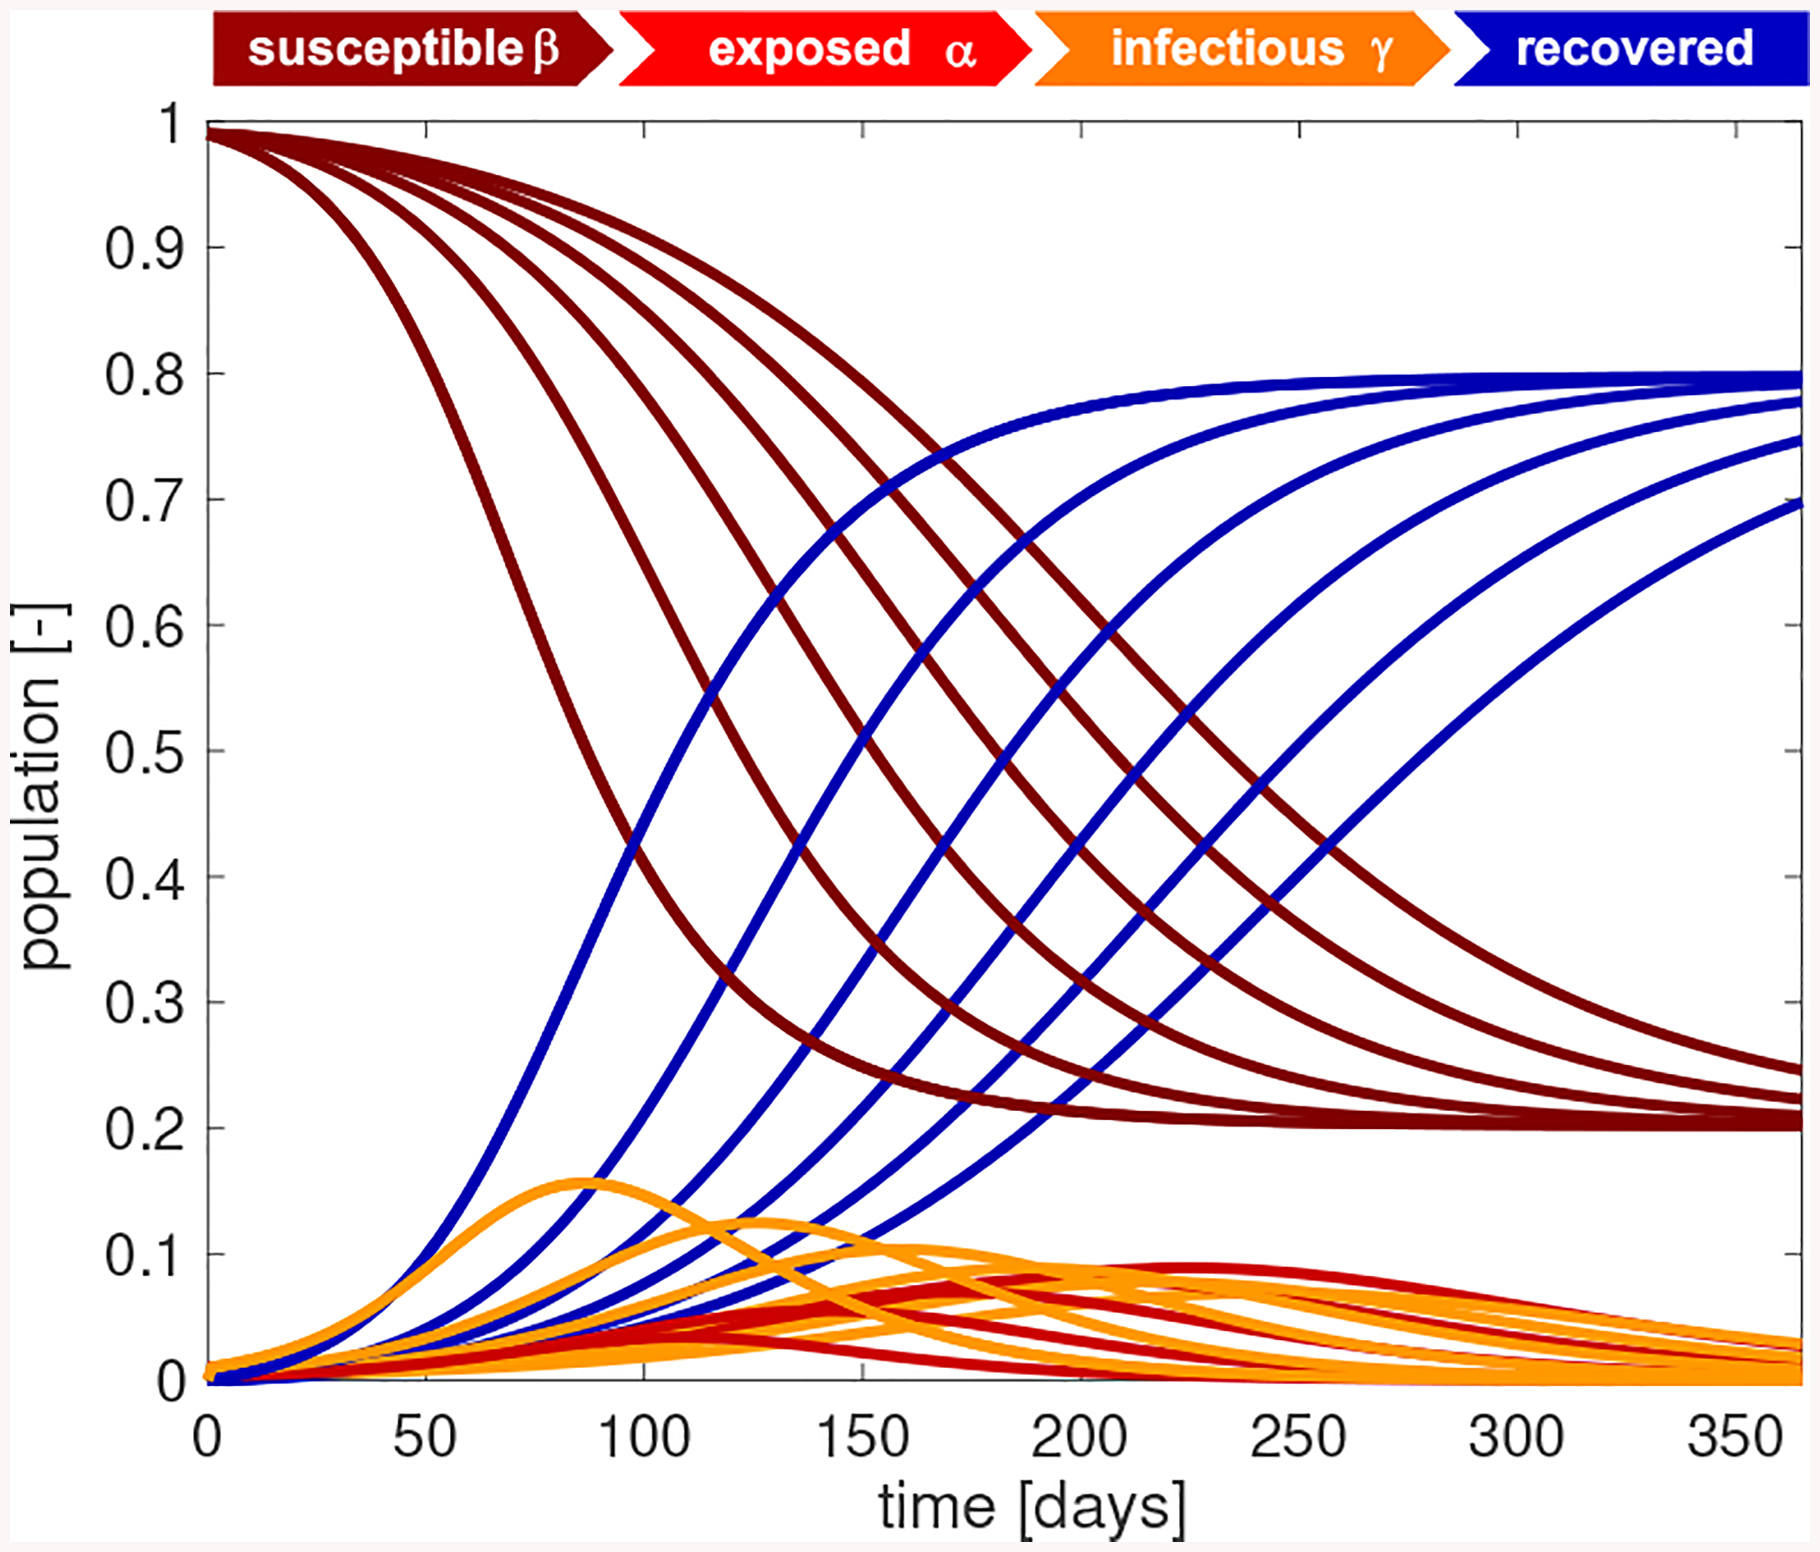
Fig. 4. Outbreak dynamics. Sensitivity with respect to the latent period A.

Increasing the latent period increases the exposed population and decreases the infectious population. The susceptible and recovered populations converge to the same endemic equilibrium at S∞ = 0.202 and R∞ = 0.798, however, slower. The steepest susceptible, infectious, and recovery curves correspond to the SIR model without separate exposed population E with A = 0 days with a maximum infectious population of Imax = 0.157 after 86 days. Latent period A = 0, 5, 10, 15, 20, 25 days, infectious period C = 20 days, basic reproduction number R0 = C/B = 2.0, and initial exposed fraction E0 = 0.010.
