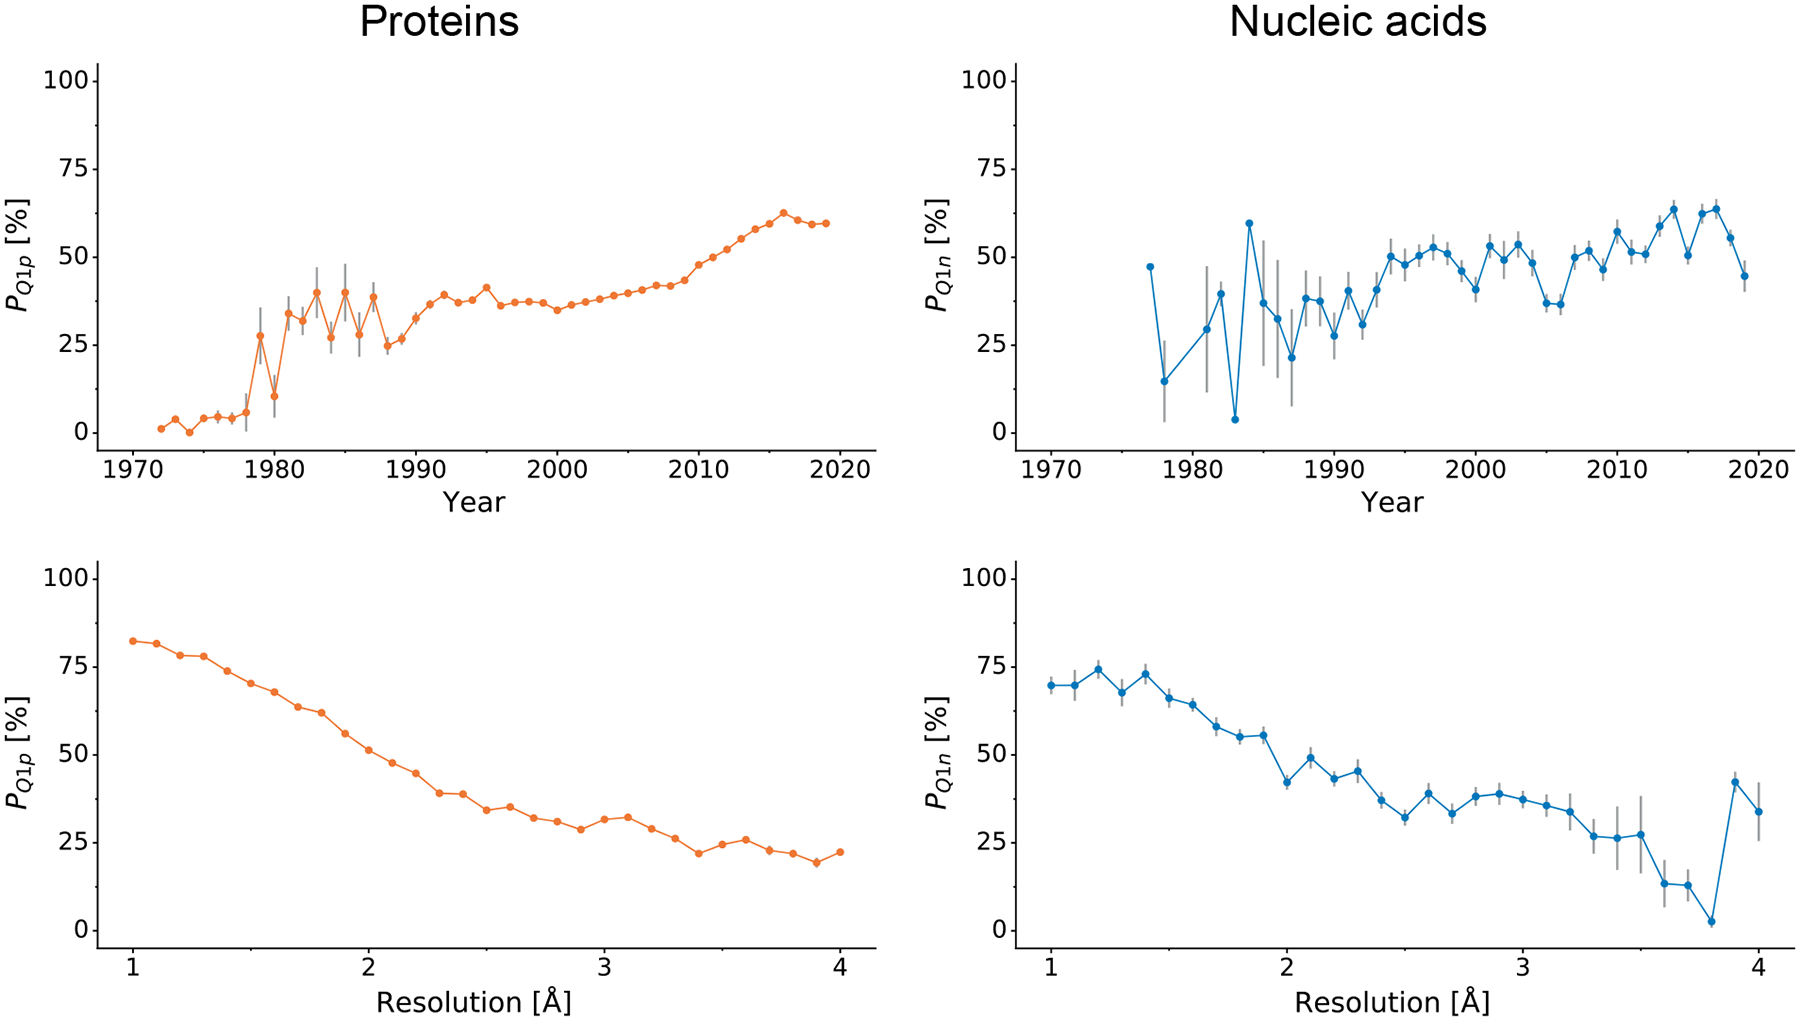
Figure 1. PQ1 analysis.

Variation in the mean PQ1 percentile (higher is better) over time (top) and as a function of resolution (bottom) for proteins (left) and nucleic acids (right). Error bars indicate estimated unbiased standard errors of the mean.
