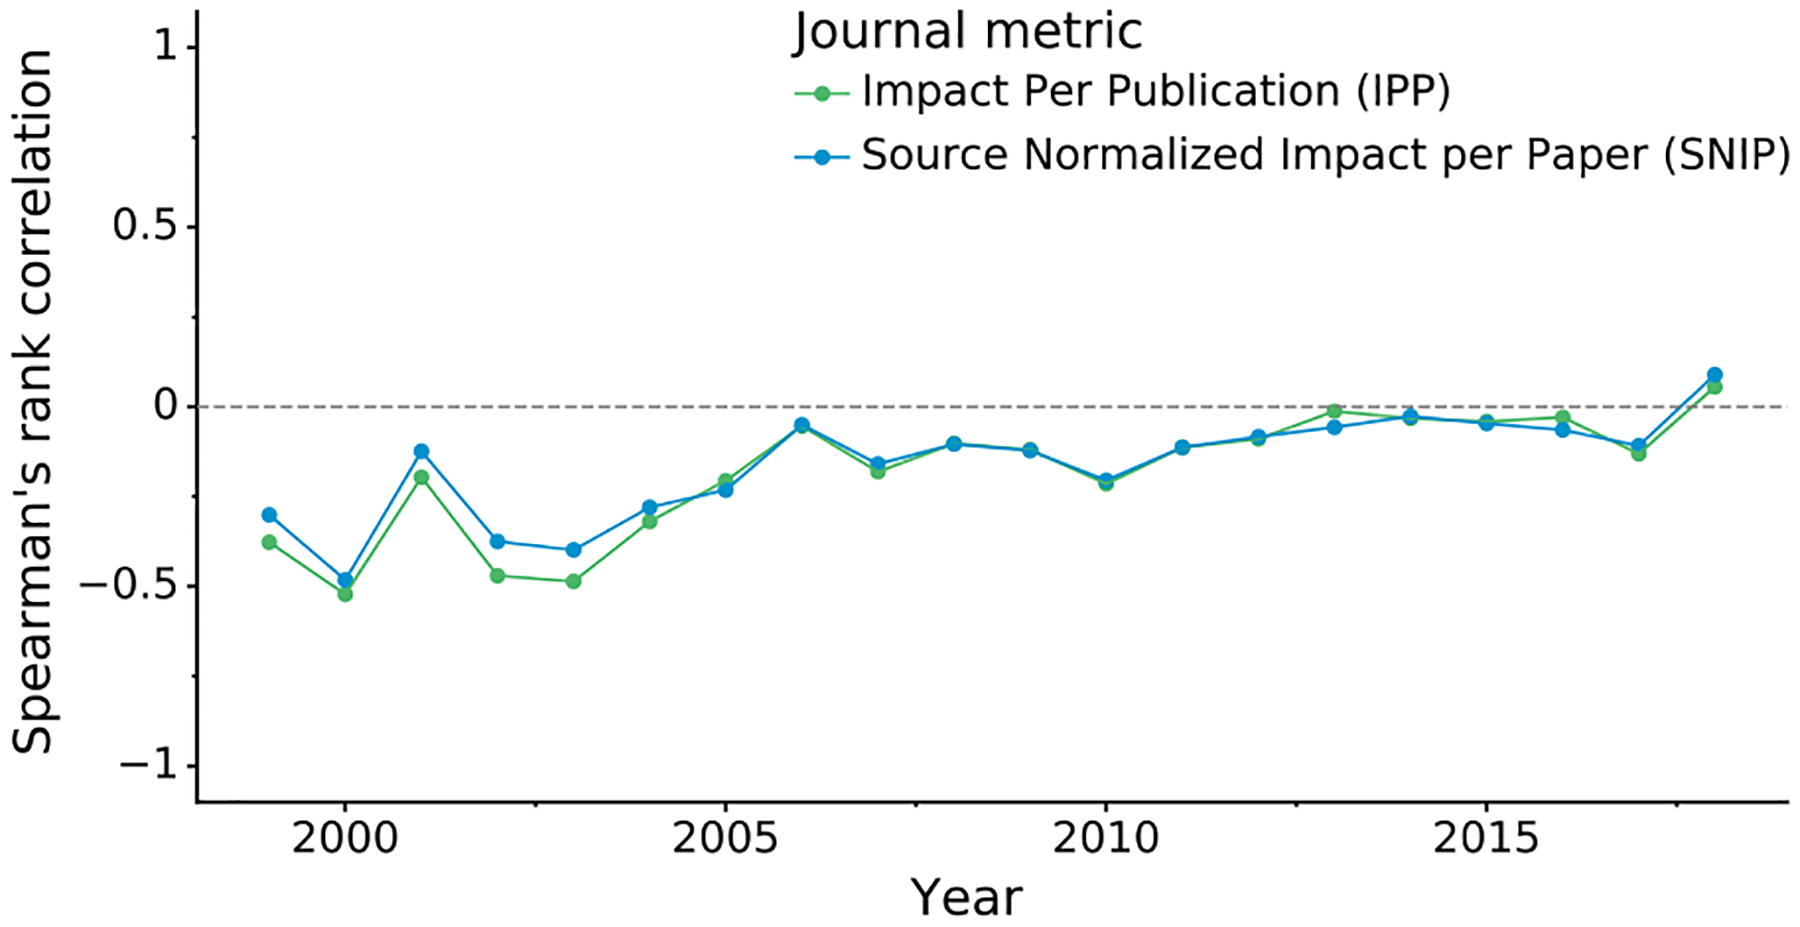
Figure 5. Correlation between structure quality and journal impact.

The plot shows Spearman’s rank correlation (y-axis) over time (x-axis) between structure quality measured by PQ1(t,d) and journal impact measured using the IPP and SNIP metrics. IPP uses the same formula as the 3-year Impact Factor but is based on Scopus data, whereas SNIP additionally takes into account the scientific field.
