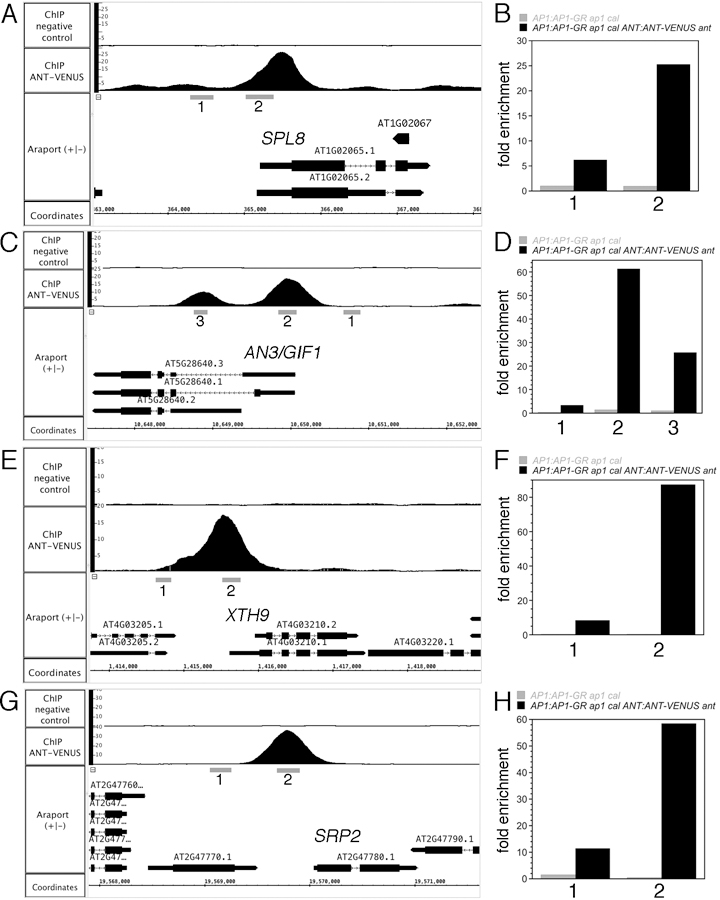
Figure 6. ChIP-qPCR confirms that ANT binds to genomic regions upstream or within genes associated with stamen development (SPL8) and growth (AN3/GIF1, XTH9, SRP2).

ChIP-Seq coverage graphs for SPL8 (A), AN3/GIF1 (B), XTH9 (E), and SRP2 (G). Numbers below the gene indicate the regions tested for ANT binding by ChIP-qPCR. ChIP-qPCR data for SPL8 (B), AN3/GIF1 (D), XTH9 (F) and SRP2 (H). Grey bars show results from AP1:AP1-GR ap1 cal and black bars show results from AP1:AP1-GR ap1 cal ANT:ANT-VENUS ant. Numbers on the x axis correspond to the genomic regions indicated in the ChIP-Seq coverage graphs.
