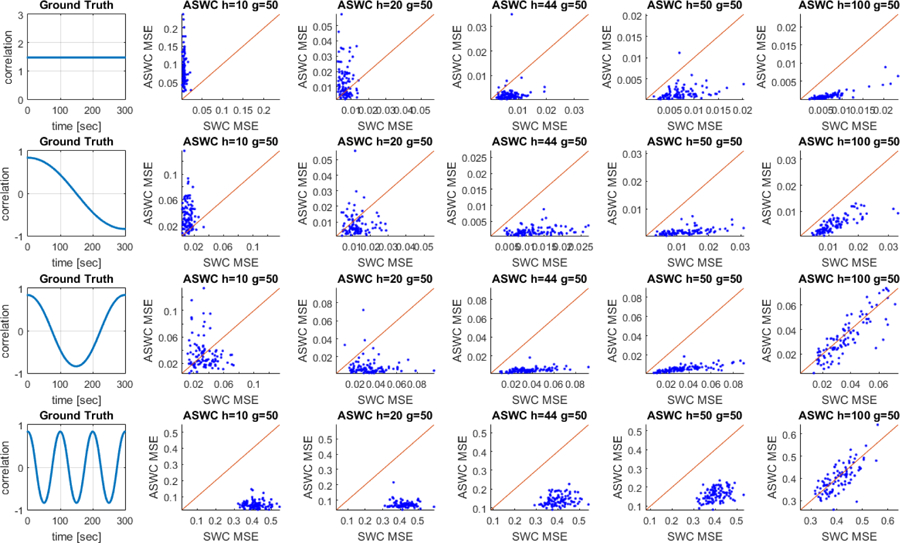
Figure 6. This plot shows the mean square error (MSE) for the ASWC and SWC methods while tracking simulated connectivity dynamics.

Four different connectivity dynamics were simulated as representing the ground truth. Time courses were simulated using a cosine summation with randomly selected phases and with phase differences at each time point designed to track the ground truth dynamics. One hundred iterations (each iteration with a different set of random phases) were performed and the MSE displayed for each case. On each ASWC vs. SWC plot, a line divides the plotting area in sections where one method has better performance than the other one.
