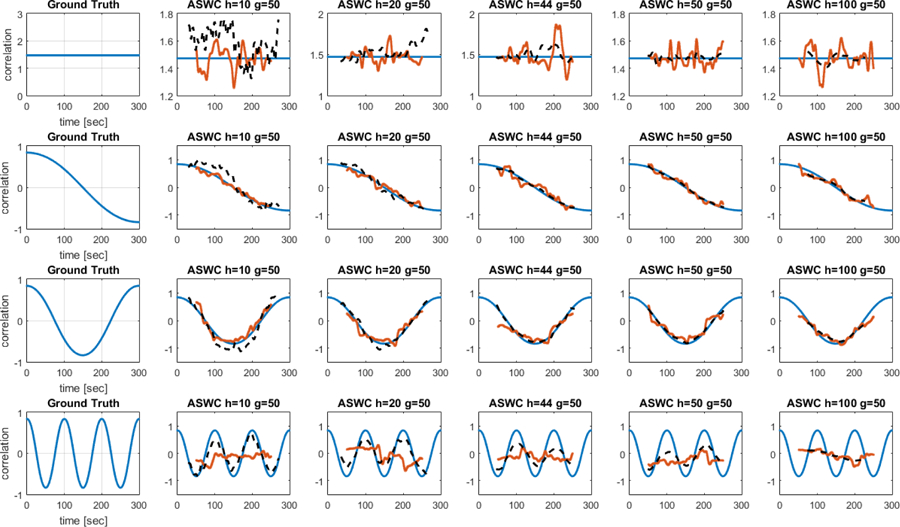
Figure 7. This plot displays one iteration of the simulation from Figure 6.

Connectivity estimations for ASWC are displayed by the broken lines in black. Continuous lines in orange represent the SWC estimation. The blue lines represent the ground truth and can be differentiated from the SWC line because they are completely smooth.
