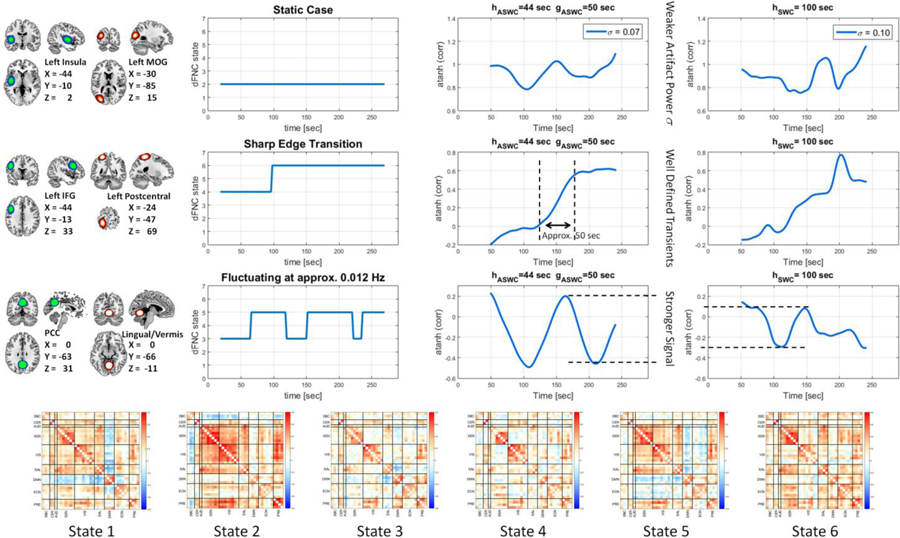
Figure 8. This plot shows several examples from real data.

This set of examples closely resembles the simulations in Figure 6 and Figure 7. Although there is no ground truth, we can estimate quasi-static, quasi sharp transitions and fluctuating dFNC using the dynamic state membership functions of each case. Centroid matrices for the six dynamic states are displayed. To better illustrate the centroids, brain areas were organized into eight domains subcortical (SBC), cerebellum (CER), auditory (AUD), sensorimotor (SEN), visual (VIS), salience (SAL), default mode network (DMN), executive control network (ECN) and precuneus (PRE). Six brain areas are used: insula, middle occipital gyrus (MOG), inferior frontal gyrus (IFG), postcentral gyrus, posterior cingulate cortex (PCC) and lingual gyrus/cerebellar vermis. Displayed coordinates are in MNI space. Brain areas and dynamic states were extracted from previous work (Vergara et al., 2018). Each row uses data from a different subject where the corresponding pattern was observed. Both SWC and ASWC were tuned to nominal values based on a lower limit frequency of 0.01 Hz. On the static case, ASWC exhibit weaker fluctuations as expected from an appropriate estimation of static connectivity. The single transition case was better defined by ASWC where a smoother and shaper slope was estimated. In the fluctuating dFNC case, ASWC shows a stronger signal than in SWC.
