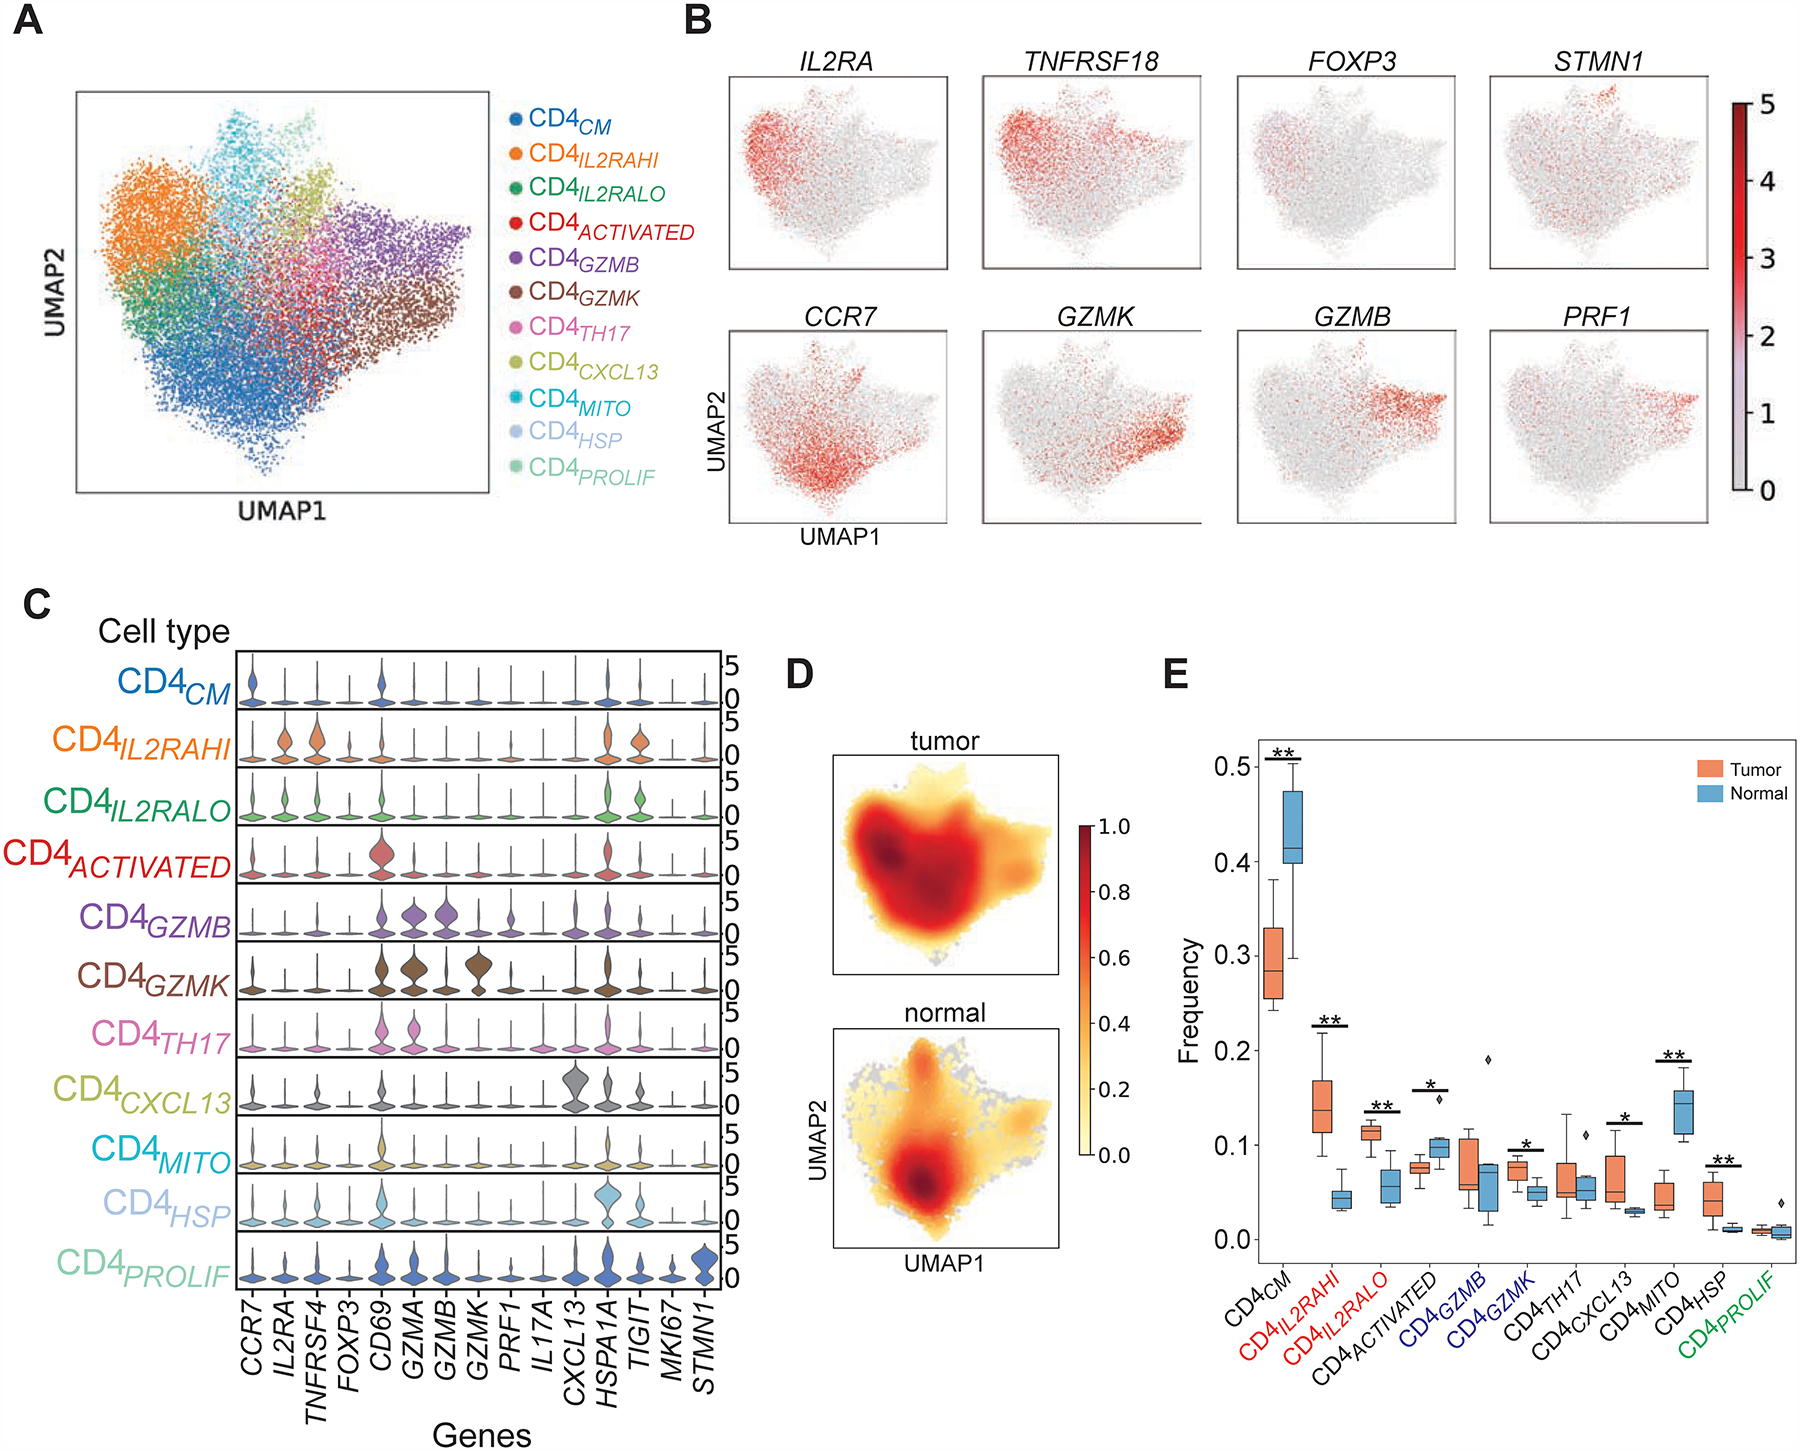
Figure 2. CD4+ T cells in bladder tumors are composed of multiple distinct functional states.

(A) UMAP plots of 19,842 single sorted CD3+ CD4+ T cells obtained from bladder tumors and adjacent non-malignant tissue (N = 7 patients). Each distinct phenotypic cluster identified using leiden clustering is identified with a distinct color. Annotation of each unbiased cluster was performed by manual inspection of highest-ranked differentially expressed genes for each cluster, and also using reference signature-based correlation methods (SingleR) as described in the text. (B) Relative intensity of expression of select genes superimposed upon the UMAP projections shown in (A). (C) Violin plot showing relative expression of select differentially expressed genes (columns) for each cluster shown in (A) (rows) (all Padj values < 0.05). (D) Density plots showing distribution of cells in tumor or non-malignant samples. (E) The frequency of cells in individual CD4+ T cell states defined by scRNA-seq clustering is shown as a proportion of total CD4+ cells within either tumor or non-malignant compartments across all patients (orange = tumor, blue = non-malignant). *, P < 0.05, **, P < 0.01 by exact permutation test.
