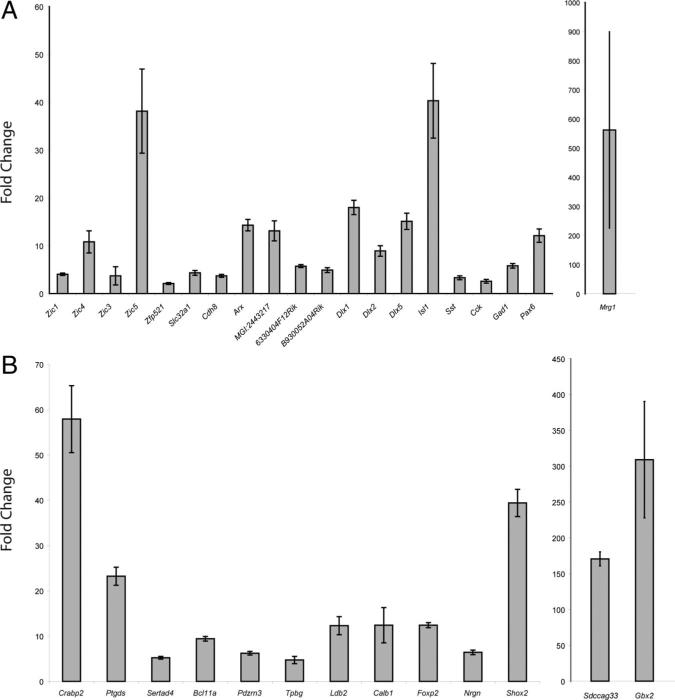
Figure 3.
Quantitative RT-PCR of LGN- and MGN-specific genes confirms differential gene expression at P0. A, P0 LGN-enriched genes are all significantly upregulated (20/20, p < 0.05, FC >2 in LGN samples vs MGN samples). B, P0 MGN-enriched genes are all significantly upregulated (13/13, p < 0.05, FC >4) as well.

