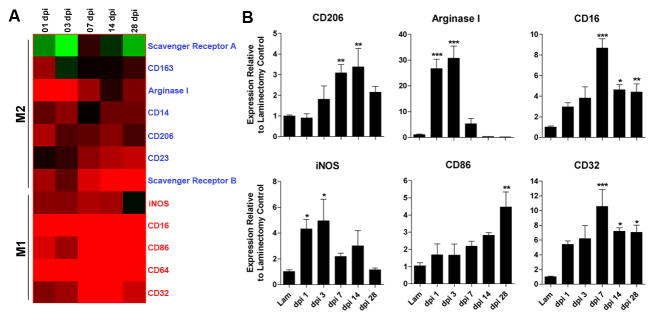
Figure 1.
Spinal cord injury induces changes in the expression of genes associated with M1 and M2 macrophages. cDNA microarray “heat-map” showing clustering of M1 and M2 genes as a function of time post-injury (A). All genes shown are up- or down-regulated >2-fold compared with uninjured controls. Black indicates no change in gene expression whereas green or red indicate a decrease or increase in expression, respectively, relative to uninjured control samples. Note transient induction of M2 genes in contrast with early and sustained induction of M1 genes. (B) Quantitative real-time PCR confirms select M1 and M2 gene expression changes noted via microarray; n= 4/time for microarray; n=3–5/time for PCR). (ANOVA p<0.01 for all genes; *p<0.05, **p<0.01, ***p<0.001 vs laminectomy control.)

