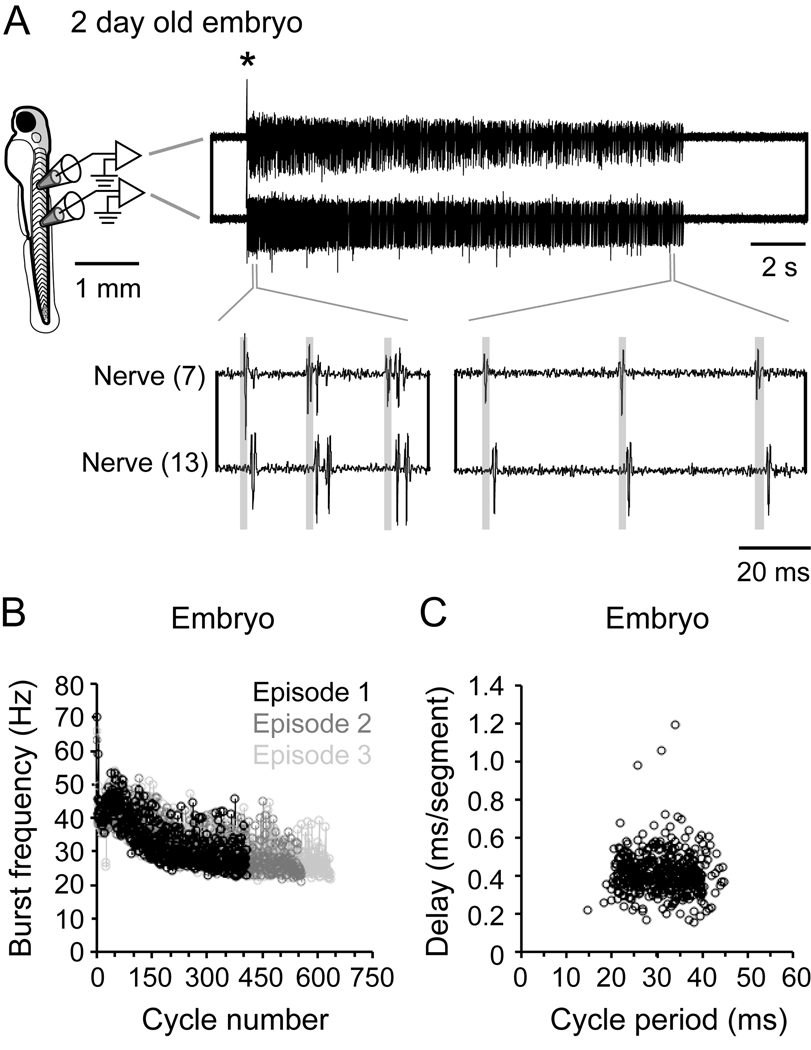
Figure 2. Fictive swimming motor pattern in embryos.
A: A schematic on the left illustrates the position from which motor nerve recordings illustrated on the right are taken (7th and 13th body segment). An electrical stimulus delivered to the tail was used to elicit swimming (artifact at asterisk). The top right panel illustrates a single episode of swimming on a slower time base, while the bottom right panel illustrates, on a faster time base, motor bursts that would drive cyclical bending. Transparent gray boxes illustrate the head to tail delay of motor bursts.
B: Plot of motor nerve burst frequency (measured from the tail) with respect to the cycle in the episode, from 3 electrically-evoked episodes in the same embryo.
C: Plot of head-tail motor burst delay versus cycle period in a single embryo. These data are compiled from one episode of electrical stimulus induced swimming from one embryo. Correlation values: R = −0.08, p = 0.10, n = 406 cycles.

