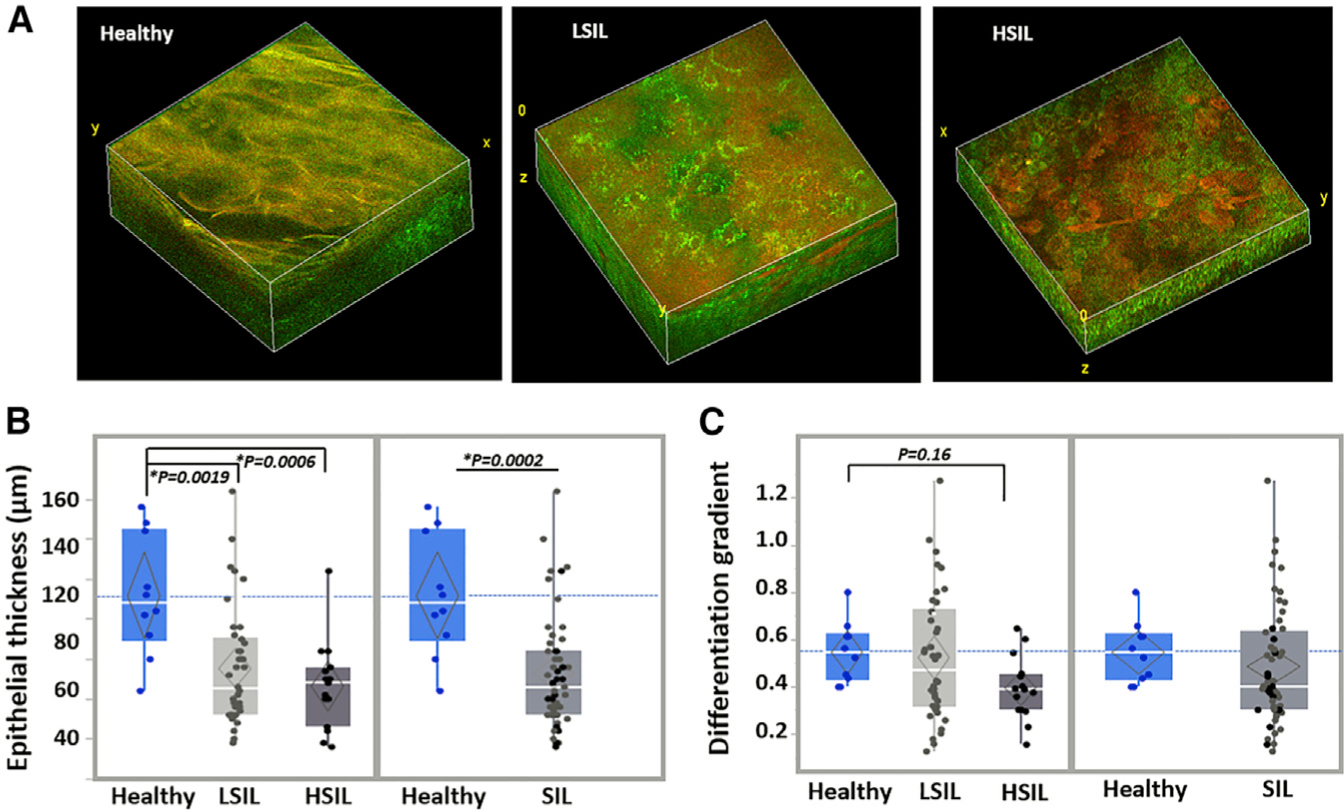
Figure 1. Morphological and Differentiation-Related Depth-Dependent Feature Variations Are Detected in Healthy and Precancerous Human Cervical Epithelia.

(A) Representative endogenous TPEF 3D image reconstructions from healthy, LSIL, and HSIL cervical tissues. Individual TPEF images are created by the overlay of NAD(P)H and FAD fluorescence, which are pseudo-colored green and red, respectively. 3D reconstruction volumes correspond to healthy: 238 × 238 × 160 μm3/SIL: 238 × 238 × 120 μm3/HSIL: 238 × 238 × 60 μm3.
(B) Quantification of the average epithelial thickness detected from the healthy (blue; N = 4 participants; 10 tissue stacks), LSIL (light gray; N = 16 participants; 38 tissue stacks), and HSIL (dark gray; N = 5 participants; 15 tissue stacks) cervical tissues examined. Healthy versus SIL comparisons are also presented.
(C) Automated depth-dependent quantification of the intraepithelial differentiation gradient. Healthy, LSIL, and HSIL and healthy versus SIL comparisons are presented. Exact p values shown in panels, *significance at a = 0.05.
In (B) and (C), data are presented as quantile boxplots with median (white line) and 95% confidence diamond around the mean (gray diamond). Each point represents 1 optical image stack.
