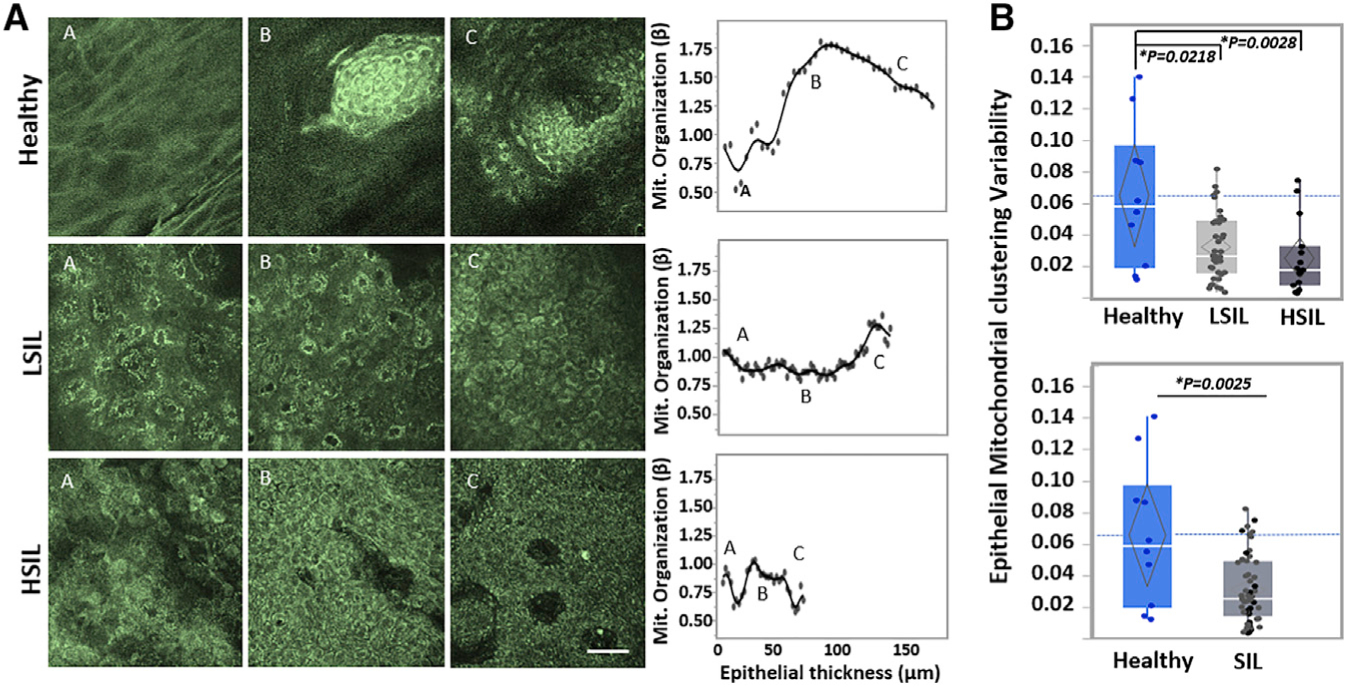
Figure 3. Depth-Dependent Mitochondrial Organization Profiles Reveal Functional Differences between Normal and Precancerous Lesions.

(A) Representative ex vivo human NAD(P)H TPEF images acquired from healthy (top), LSIL (center), and HSIL (bottom) cervical lesions. Optical sections are shown from various depths from the most superficial (left column) to the deepest layers (right column). The corresponding depth-dependent mitochondrial organization profiles for the entire epithelial stacks are shown in the rightmost column. Scale bar, 50 μm for all images.
(B) Epithelial mitochondrial clustering variability extracted from the mitochondrial organization profiles for the healthy, LSIL, and HSIL cervical tissues examined, as detailed in Figure 1. Healthy versus SIL comparisons are also presented. Exact p values shown in figure; *significance at a = 0.05. Data are presented as quantile boxplots with median (white line) and 95% confidence diamond around the mean (gray diamond). Each point represents 1 optical image stack.
