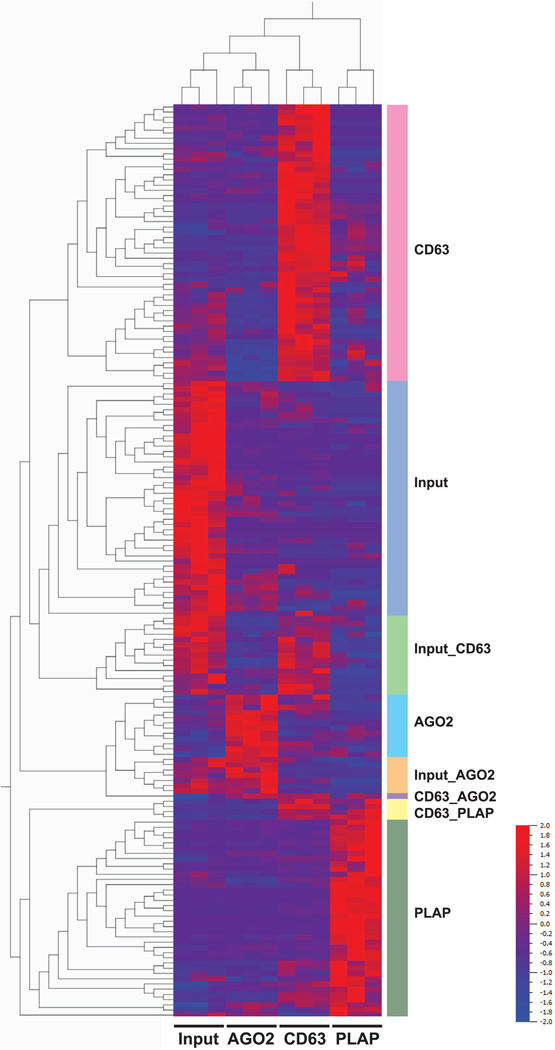
Figure 3. Cell and Tissue miRNA Expression and Deconvolution Analysis.
(A) PCA plot showing unsupervised clustering of cell and tissue types by miRNA profiling data.
(B) Hierarchical clustering of cell and tissue types with heatmap of differentially expressed miRNAs (q < 10−12).
(C) Box-and-whisker plot of deconvolution results, indicating the percent contribution of each cell/tissue type to the extracellular miRNA profiles of each of the maternal serum samples in this study (both discovery and verification cohorts; n = 212).
(D) Bar graphs showing, for each cell/tissue type, the number of numerators/univariate predictors (top) and denominators (bottom) for which that cell/tissue type was a major contributor.
See also Table S5.

