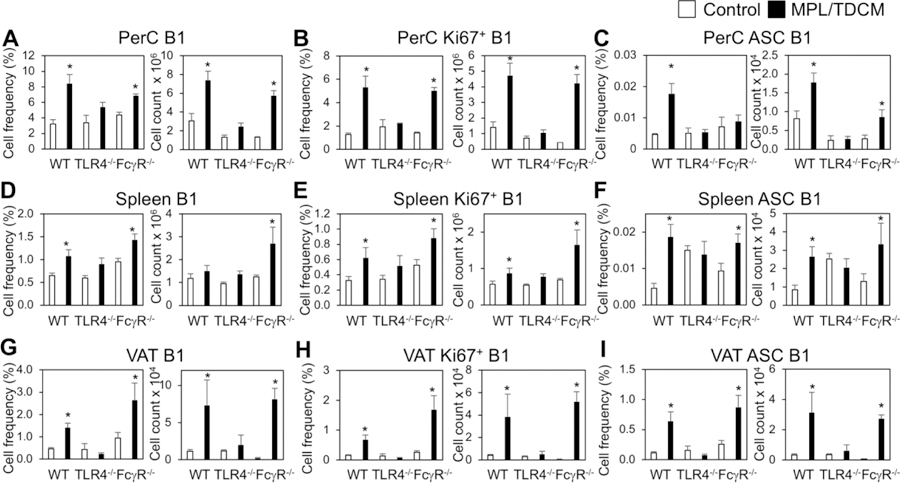
Figure 2. B-1 cell activation, division, and ASC differentiation following MPL/TDCM treatment is impaired in the absence of TLR4 signaling.

(A–I) WT, FcγR−/− and TLR4−/− mice were challenged with 2.5 × 10⁴ TA3-Ha cells ± MPL/TDCM on day 0. On day 5, peritoneal lavage, spleen and visceral adipose tissue (VAT) were harvested and analyzed via flow cytometry. Graphs show B1 cell (CD19+CD11b+) frequencies and numbers in the peritoneal cavity (PerC, A) and spleen (Spl, D) and VAT (G); frequencies and numbers of dividing (Ki67+) B1 cells in peritoneal cavity (B), spleen (E) and VAT (H); and frequencies and numbers of BLIMP1+CD138+ B1 cells in peritoneal cavity (C), spleen (F), and VAT (I). Values represent means ± SEM. Asterisks (*) indicate significant differences between treated and untreated mice of the same genotype (n=3–5 mice/group).
