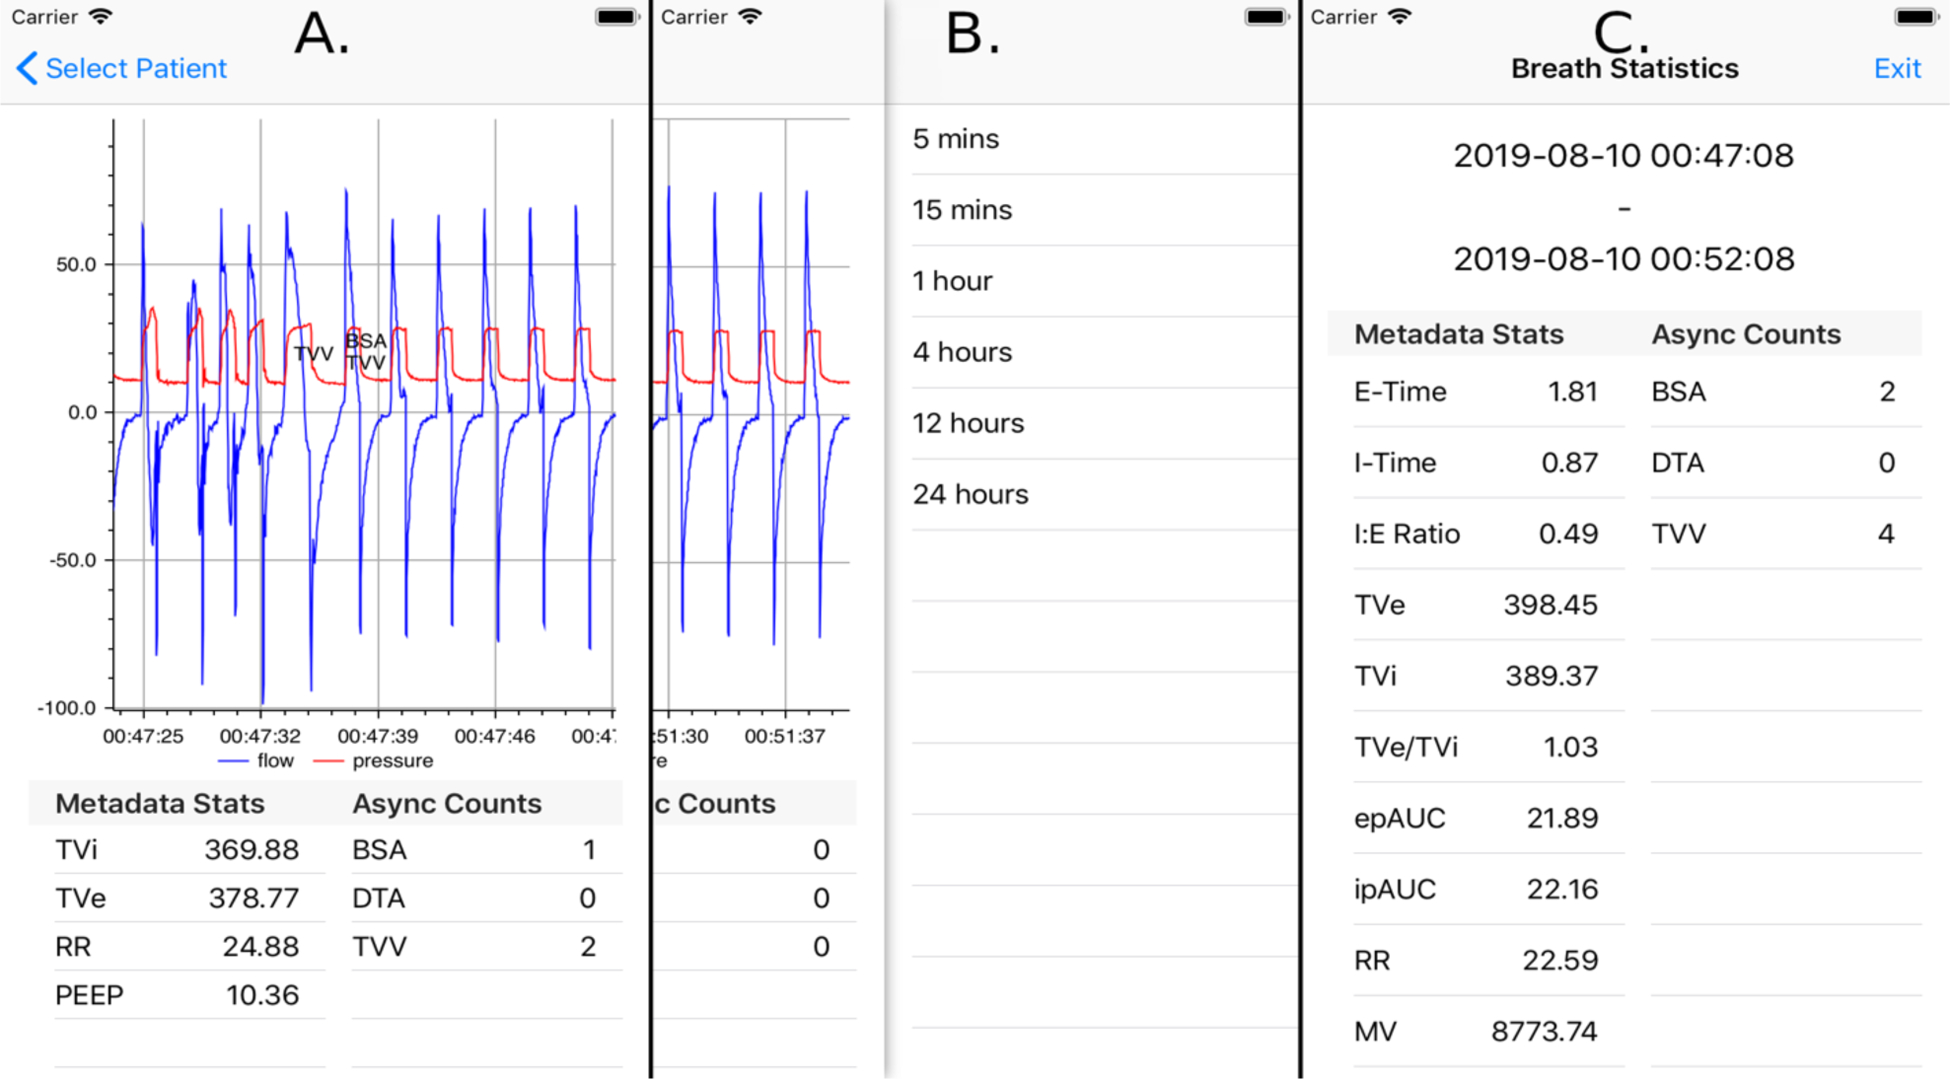
Figure 4:

A. Mobile application displaying waveform data of one patient, with breaths labeled with detected asynchronies and excessive tidal volumes. The area below the chart contains statistics of breaths currently being displayed. Pinch-zoom functionality allows custom selection of time frames for waveform display, summary statistics, and event labeling. B. Discrete look back time frames over which breath statistics can be calculated. These options are selected via left swipe from the screen displaying patient waveform information. C. Example result of breath statistics calculated for a 5-minute time frame. Both clinically relevant metadata and PVA statistics are shown.
