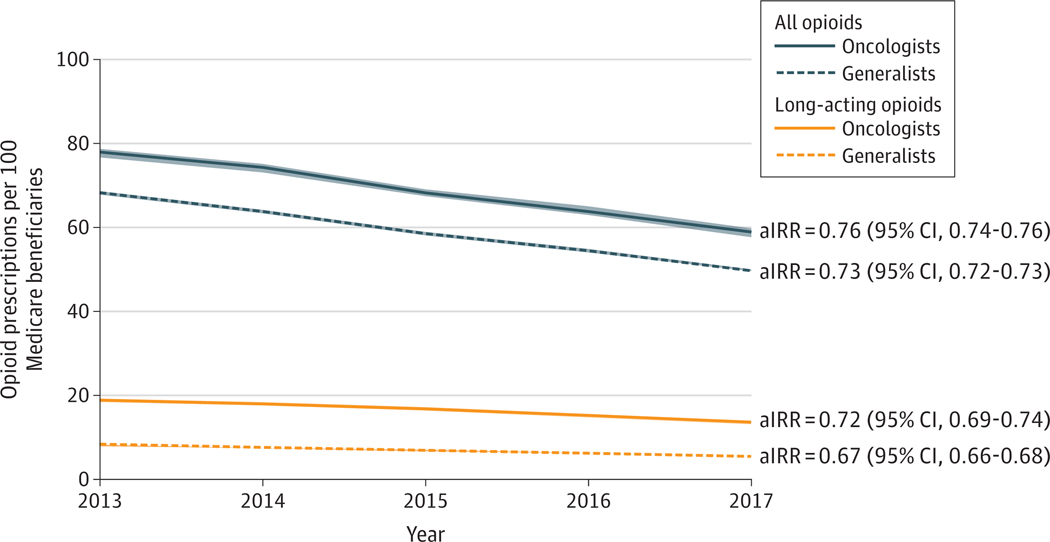
Figure. Annual Predicted Incidence Rates of Opioid Prescriptions per 100 Medicare Beneficiaries.
Analyses were estimated using Poisson regression with prescriber-level data, with SEs clustered for prescriber and adjusting for prescriber sex, mean patient age, mean risk score, and state fixed effects. The 95% CIs are represented as light-colored bands around each predicted rate line. Adjusted incidence rate ratios (aIRRs) reported for each specialty opioid category represent the relative change in adjusted incidence rate in 2017 compared with 2013. For all 4 categories, aIRRs were statistically significant at P < .001.

