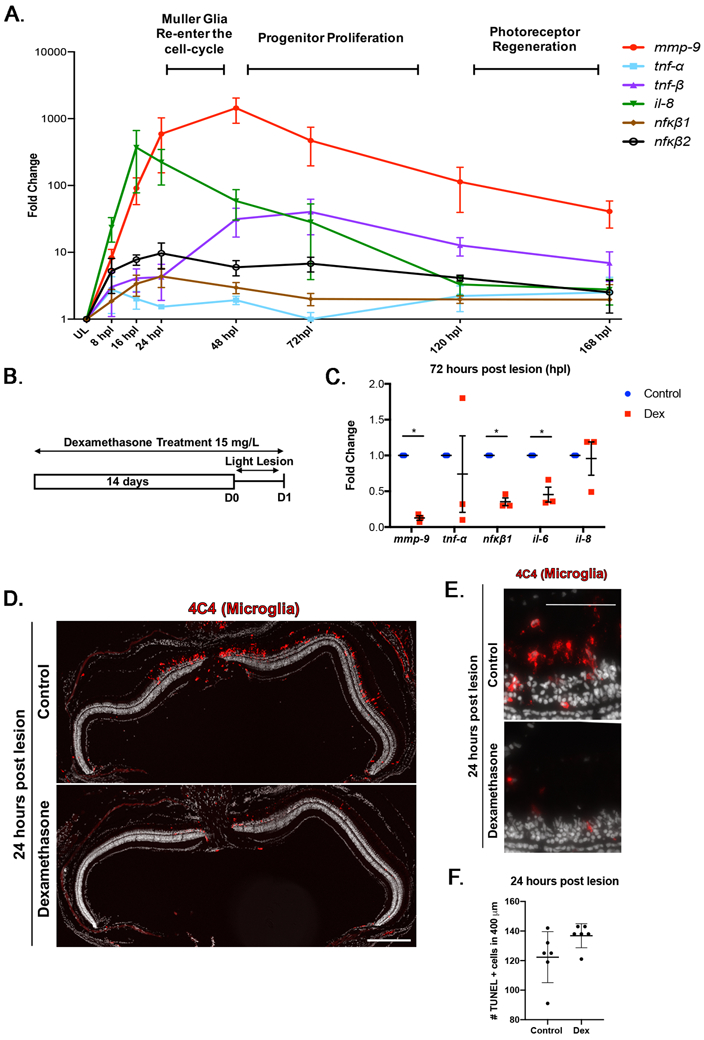
Figure 1: Inflammation is induced following photoreceptor ablation, Dexamethasone treatment suppresses microglia activation and cytokine production, but not photoreceptor death.

(A) Time-course for the expression of inflammatory genes, from 8 to 168 hours post lesion (hpl). Unlesioned retinas served as controls. Expression levels are represented as fold change calculated using DDCT method. (B) Experimental paradigm for the immune suppression and BrdU labeling. (C) qRT-PCR for the inflammatory genes mmp-9 (ANOVA F-ratio = 22.237, p<.0001), tnf-α (ANOVA F-ratio = 1.5507, p =.2209), tnf-β (ANOVA F-ratio = 6.5120, p =.001), il-8 (ANOVA F-ratio = 8.2296, p =.0003), nfκb1 (ANOVA F-ratio = 2.5207, p =.0596), and nfκb2 (ANOVA F-ratio = 3.5591, p =.0168) from control and Dex-treated retinas at 72 hpl. *p≤0.05. (D) Immunostaining for microglia using the 4C4 antibody in control (top) and Dex-treated retinas (bottom). (E) High magnification image of 4C4 staining at 1 dpl control (top) and Dex-treated retinas (bottom). (F) The number of TUNEL positive cells at 1 dpl in control (122.27 ± 17.03 cells; n=6) and Dex-treated animals (136.93 ± 8.29 cells; n=6). Scale bar equals 50μm.
