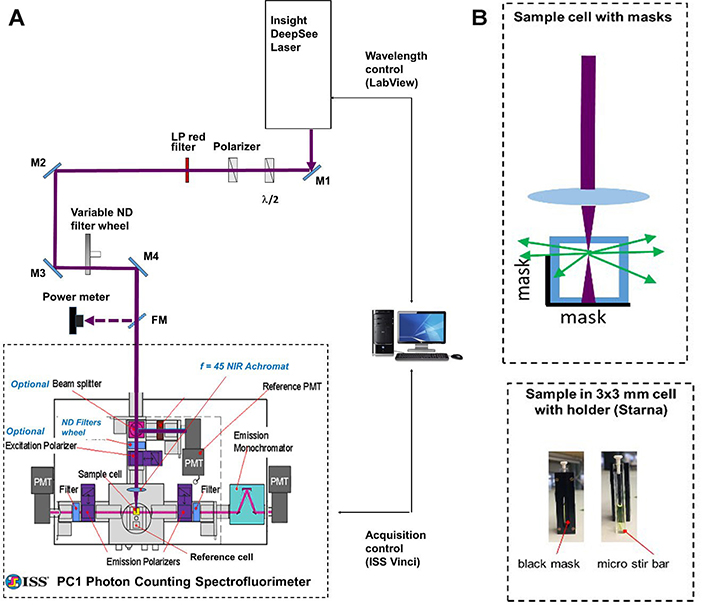
Figure 1. Schematic of experimental setup.
A. General layout. A femtosecond InSight DeepSee (SpectraPhysics) laser beam is steered with a system of mirrors (M1-M4) to the entrance aperture of a photon counting spectrofluorimeter PC1 (ISS). Automatic wavelength-to-wavelength tuning of the laser is controlled with a custom LabView program and the fluorescence signal acquisition is accomplished with the ISS Vinci software. B. Top: Schematic of the geometrical arrangement of the 3 × 3 mm cuvette with the sample solution (top view). The laser beam (dark red) is focused with an f = 45 mm lens into a frontal part of the solution. The fluorescence is collected through a side, directed to the left emission channel through a mask. The mask is a narrow rectangle of black paper fixed inside the cuvette holder that allows only the fluorescence from the front 0.7 mm of solution to get out. Bottom: A cuvette with a sample solution inside the holder is shown from the side of the holder having a mask (left image); the same cuvette taken out of holder having a micro stir bar on its bottom (right image).

