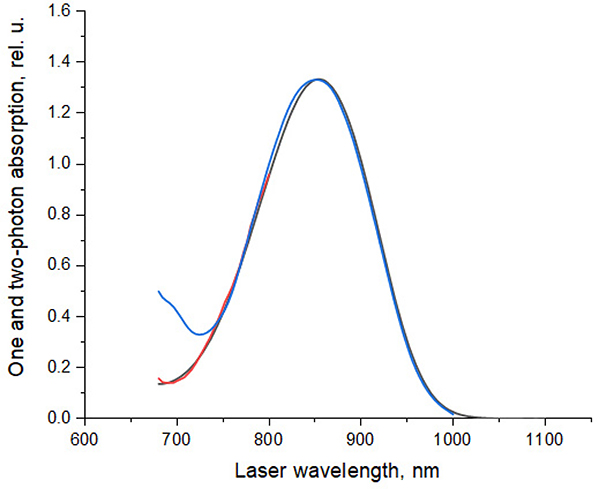
Figure 17. Spectral shapes on 1PA and 2PA spectra of Coumarin 540A in DMSO.
The 1PA spectrum measured in this work, black line, and 2PA spectrum (de Reguardati et al., 2016), blue line, are normalized at their peak values. The short wavelength part of the 2PA spectrum (680–800 nm), red line, was measured in this work, using Prodan in DMSO (de Reguardati et al., 2016) as a standard.

