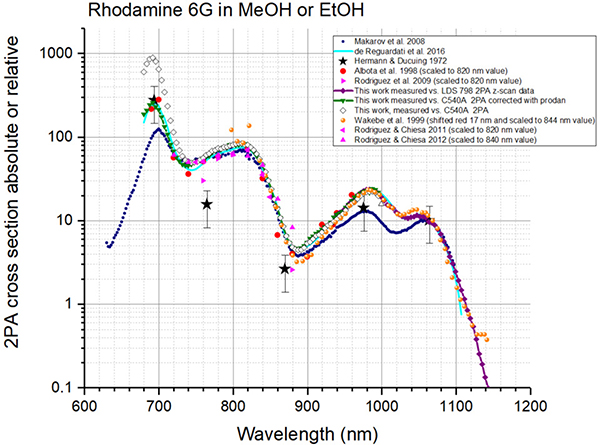
Figure 18. Two-photon absorption spectra (logarithmic scale) of Rhodamine 6G in merthanol or ethanol.
The data of Hermann and Ducuing (1972)–black stars, Makarov et al. (2008)–blue circles, de Reguardati et al. (2016)–light blue line, are presented in absolute σ2 values (see footnotes a and b to Tables 3–5 after Table 5). The data of Albota et al. (1998)–red circles, Rodriguez et al. (2009)–ping right triangles; Rodriguez and Chiesa (2011)–pink left triangles, Rodriguez and Chiesa (2012)–pink up triangles are scaled (see text), and Wakebe and Van Keuren (1999)–orange circles are scaled and shifted (see text). The (scaled) spectrum obtained here using Coumarin 540A in DMSO 2PA spectrum (de Reguardati et al., 2016) as a standard, is shown by open diamonds. The spectrum measured in this work (scaled) relatively to Coumarin 540A in DMSO in 740–1,000 nm region and relatively to Prodan in DMSO in 680–740 nm region is shown by dark green down triangles connected with continuous line. The spectrum obtained in this work relatively to LDS 798 in chloroform/deuterated chloroform, is shown by purple diamonds connected with continuous line.

